CI's 10 new templates for GBS cover a broad range of focus areas. The templates were designed based on the collective experience of CI and the clients we work with.
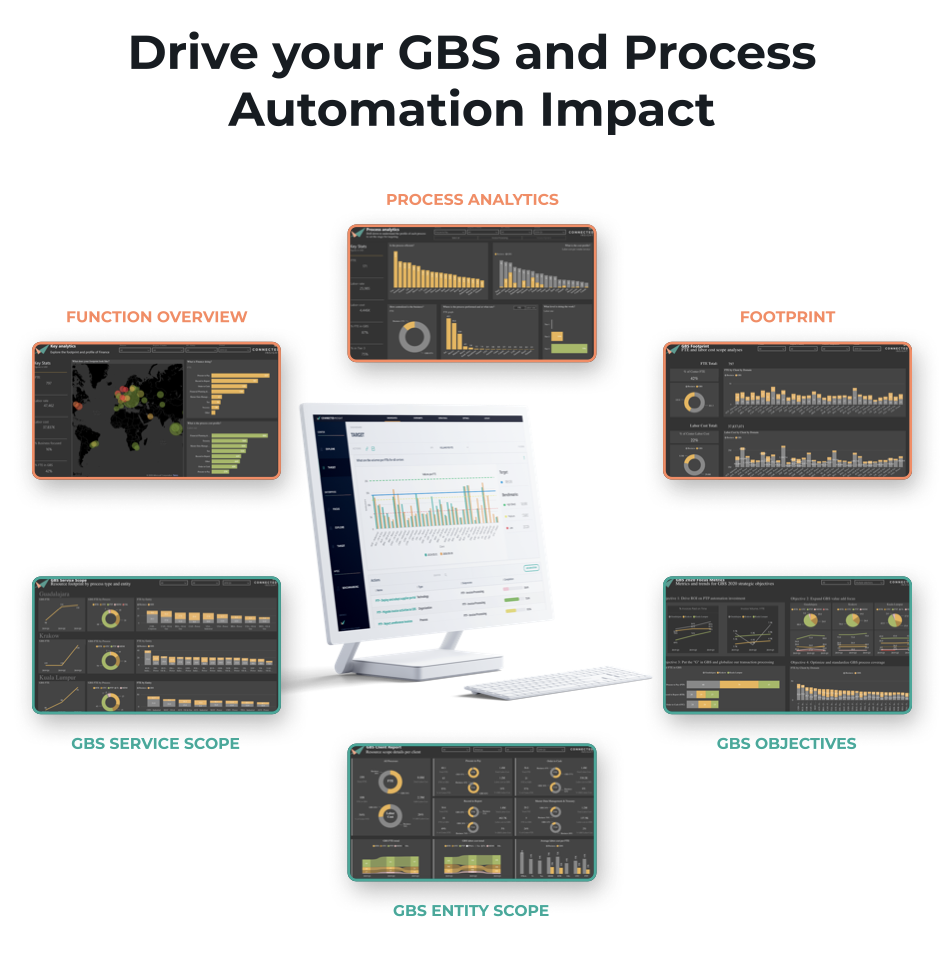
Dashboard 1: Function Overview: Visibility to your function footprint and profile across your enterprise covering both GBS and the business. End-to-end with no blind spots.
Dashboard 2: Process Analytics: Drill down to analyze your processes, end-to–end across the organization.
Dashboard 3: Targeting: Evaluate where your highest potential impact is for process automation and GBS expansion. Set informed targets.
Dashboard 4: Connected Analytics: Ties together analytics measuring objectives for efficiency and quality to analytics measuring the key drivers or dependencies.
Dashboard 5: Impact Tracking: evaluate changes in the the metrics covering your key objectives. You can toggle between multiple dimensions to assess the impact by geography, organization, process and/or location type. Benchmark where you are leading and lagging
Dashboard 6: GBS Entity Scope: Engage business leaders with data and analytics specific to their business. The GBS Entity Scope dashboard enables you to have data driven discussions on process scope, resources, cost and trends.
Dashboard 7: Footprint Analysis: Evaluate the current coverage of your GBS organization by process, sub-process and across your business entities. What is the level of scope standardization? Where are the opportunities to expand or standardize GBS service scope?
Dashboard 8: GBS Overview: If your GBS footprint includes multiple Centers, the GBS Overview dashboard gives you clear visibility to key operational data and trends by center, process and in total.
Dashboard 9: GBS Service Scope: The GBS Service Scope dashboard provides clear visibility to GBS resource and cost coverage by process, center and at entity level. The dashboard is used to evaluate current scope and level of standardization across your business, as well as evaluating where else GBS expansion could have an impact.
Dashboard 10: Focus Metrics: Do you have annual strategic objectives for your GBS organization? Do you target what impact GBS should have? Do you measure that? The Focus Metrics dashboard visualizes your objectives and enables you to engage your organization and the business with data-driven discussions.
Putting valuable data and insight at the fingertips allows your "leaders to lead". We've designed these dashboard templates to kickstart your data-driven leadership.
