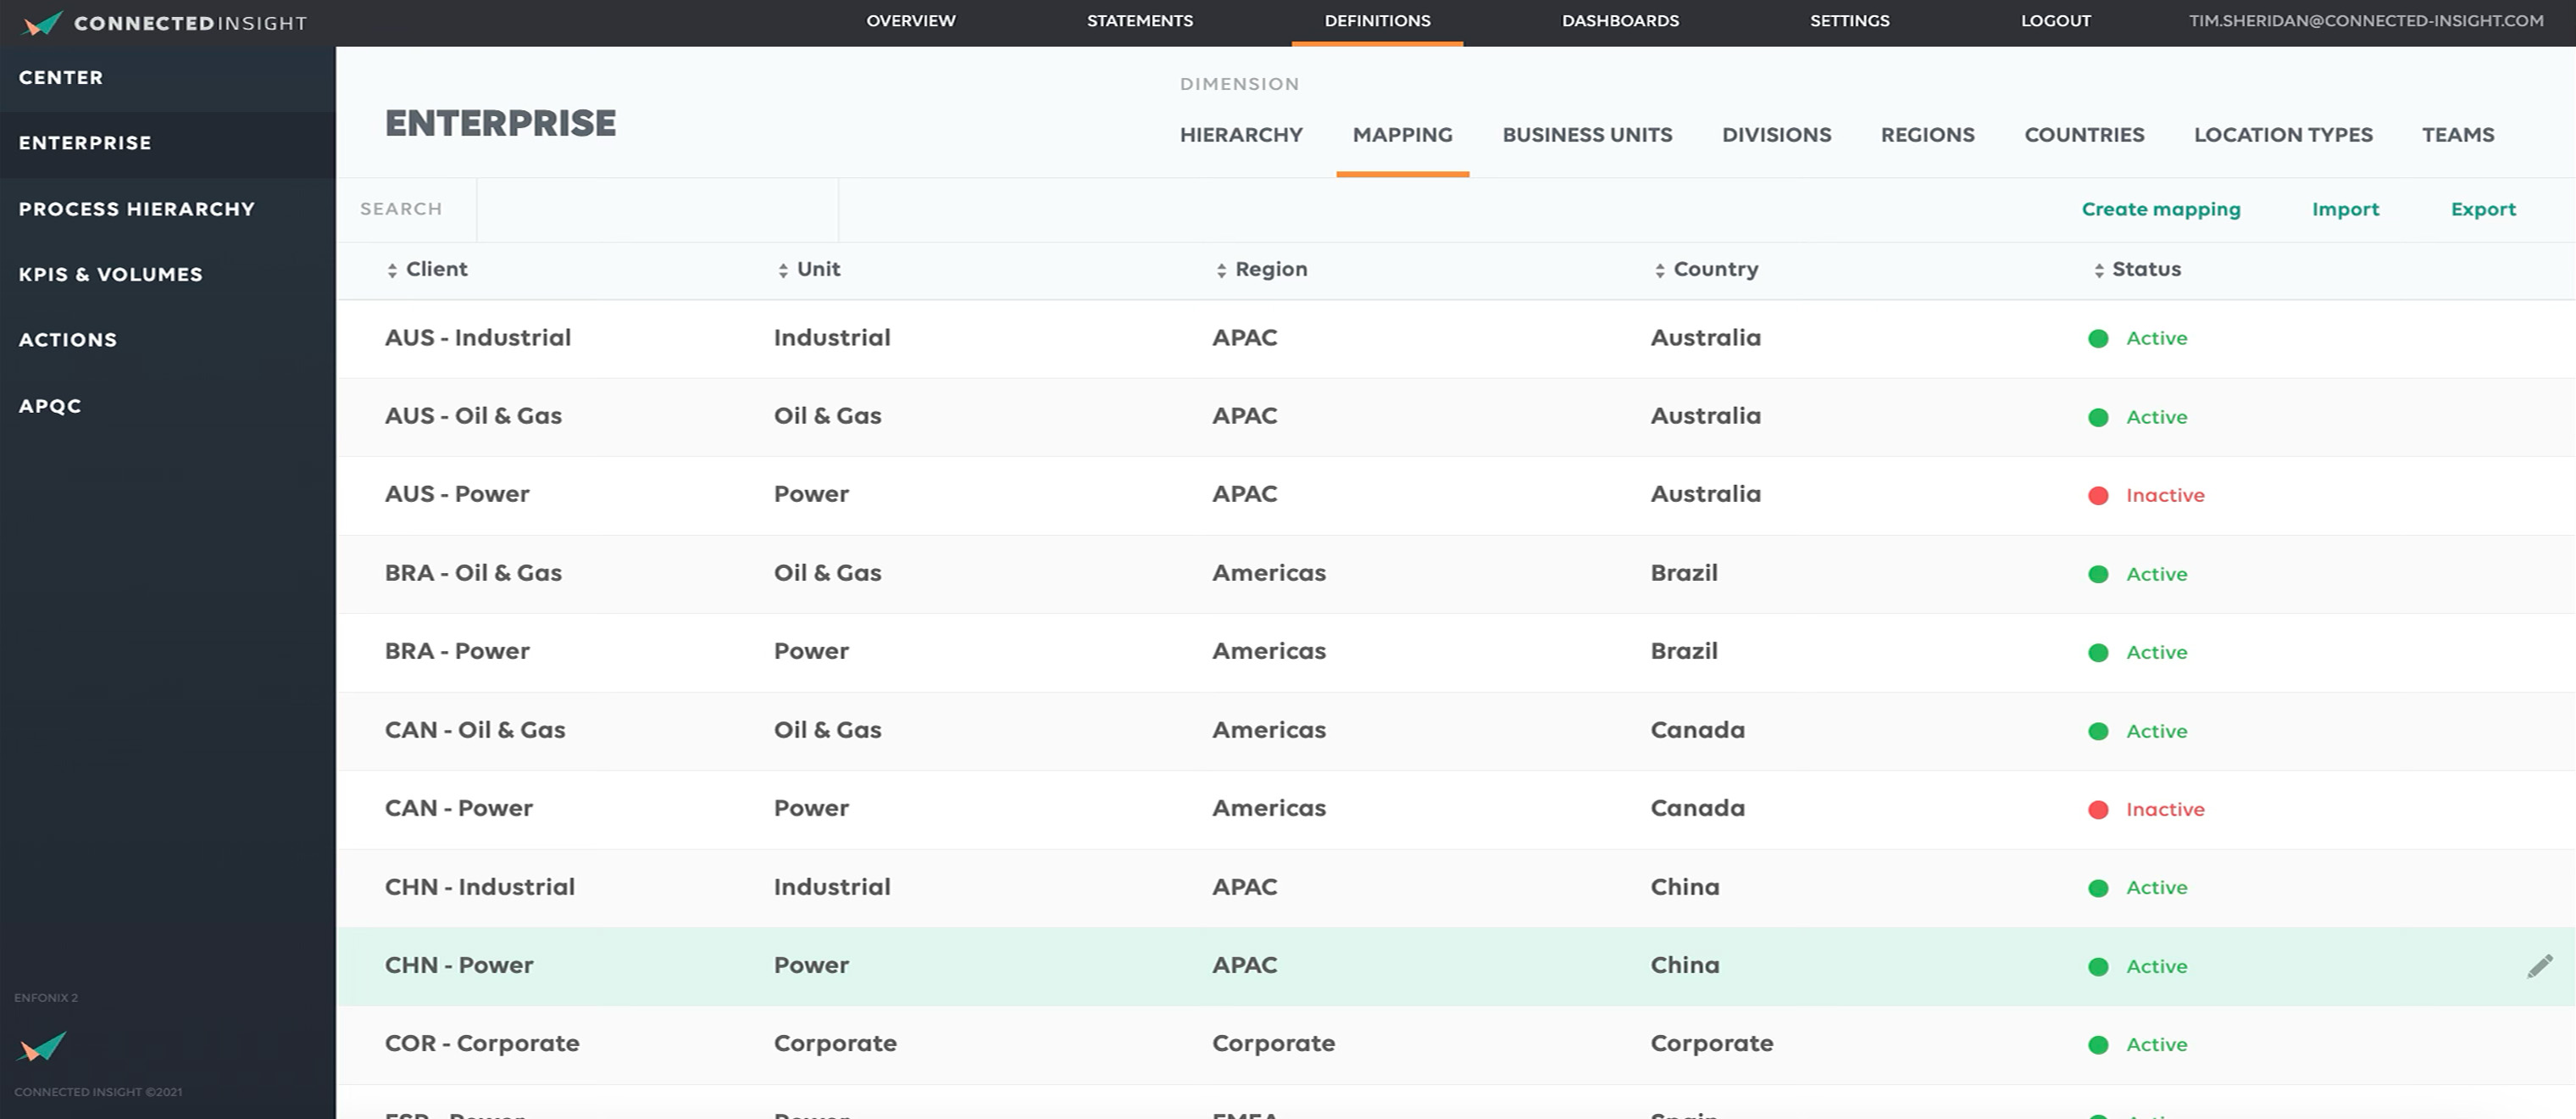
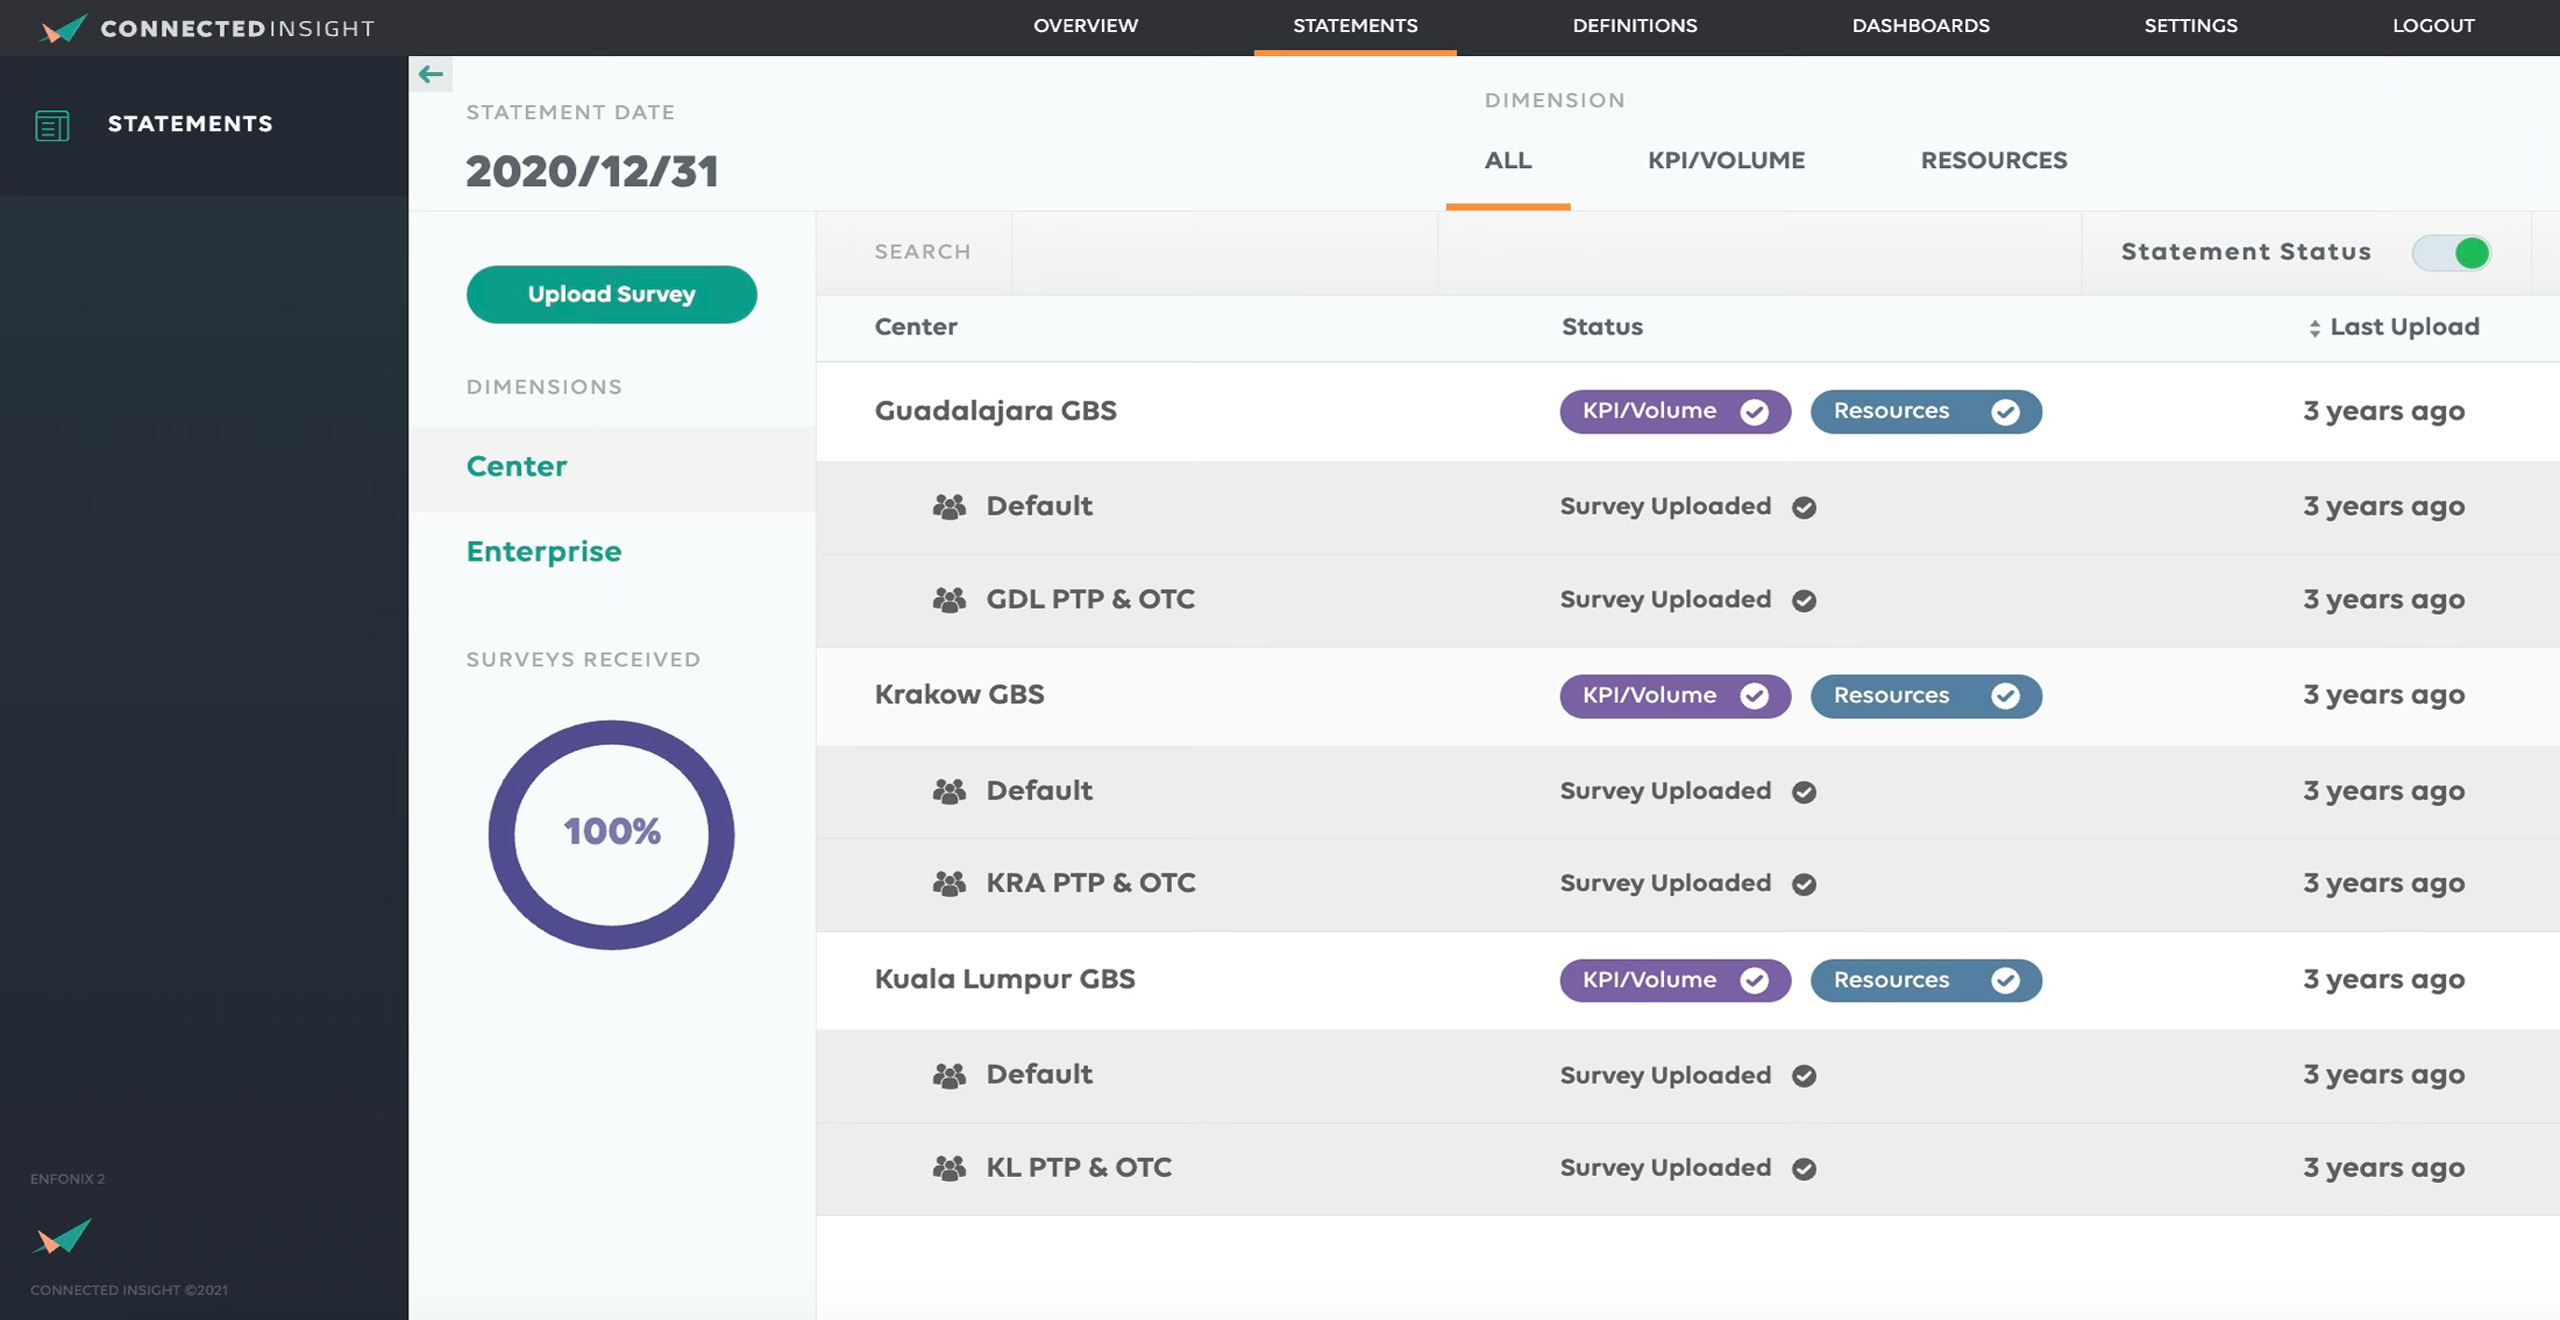
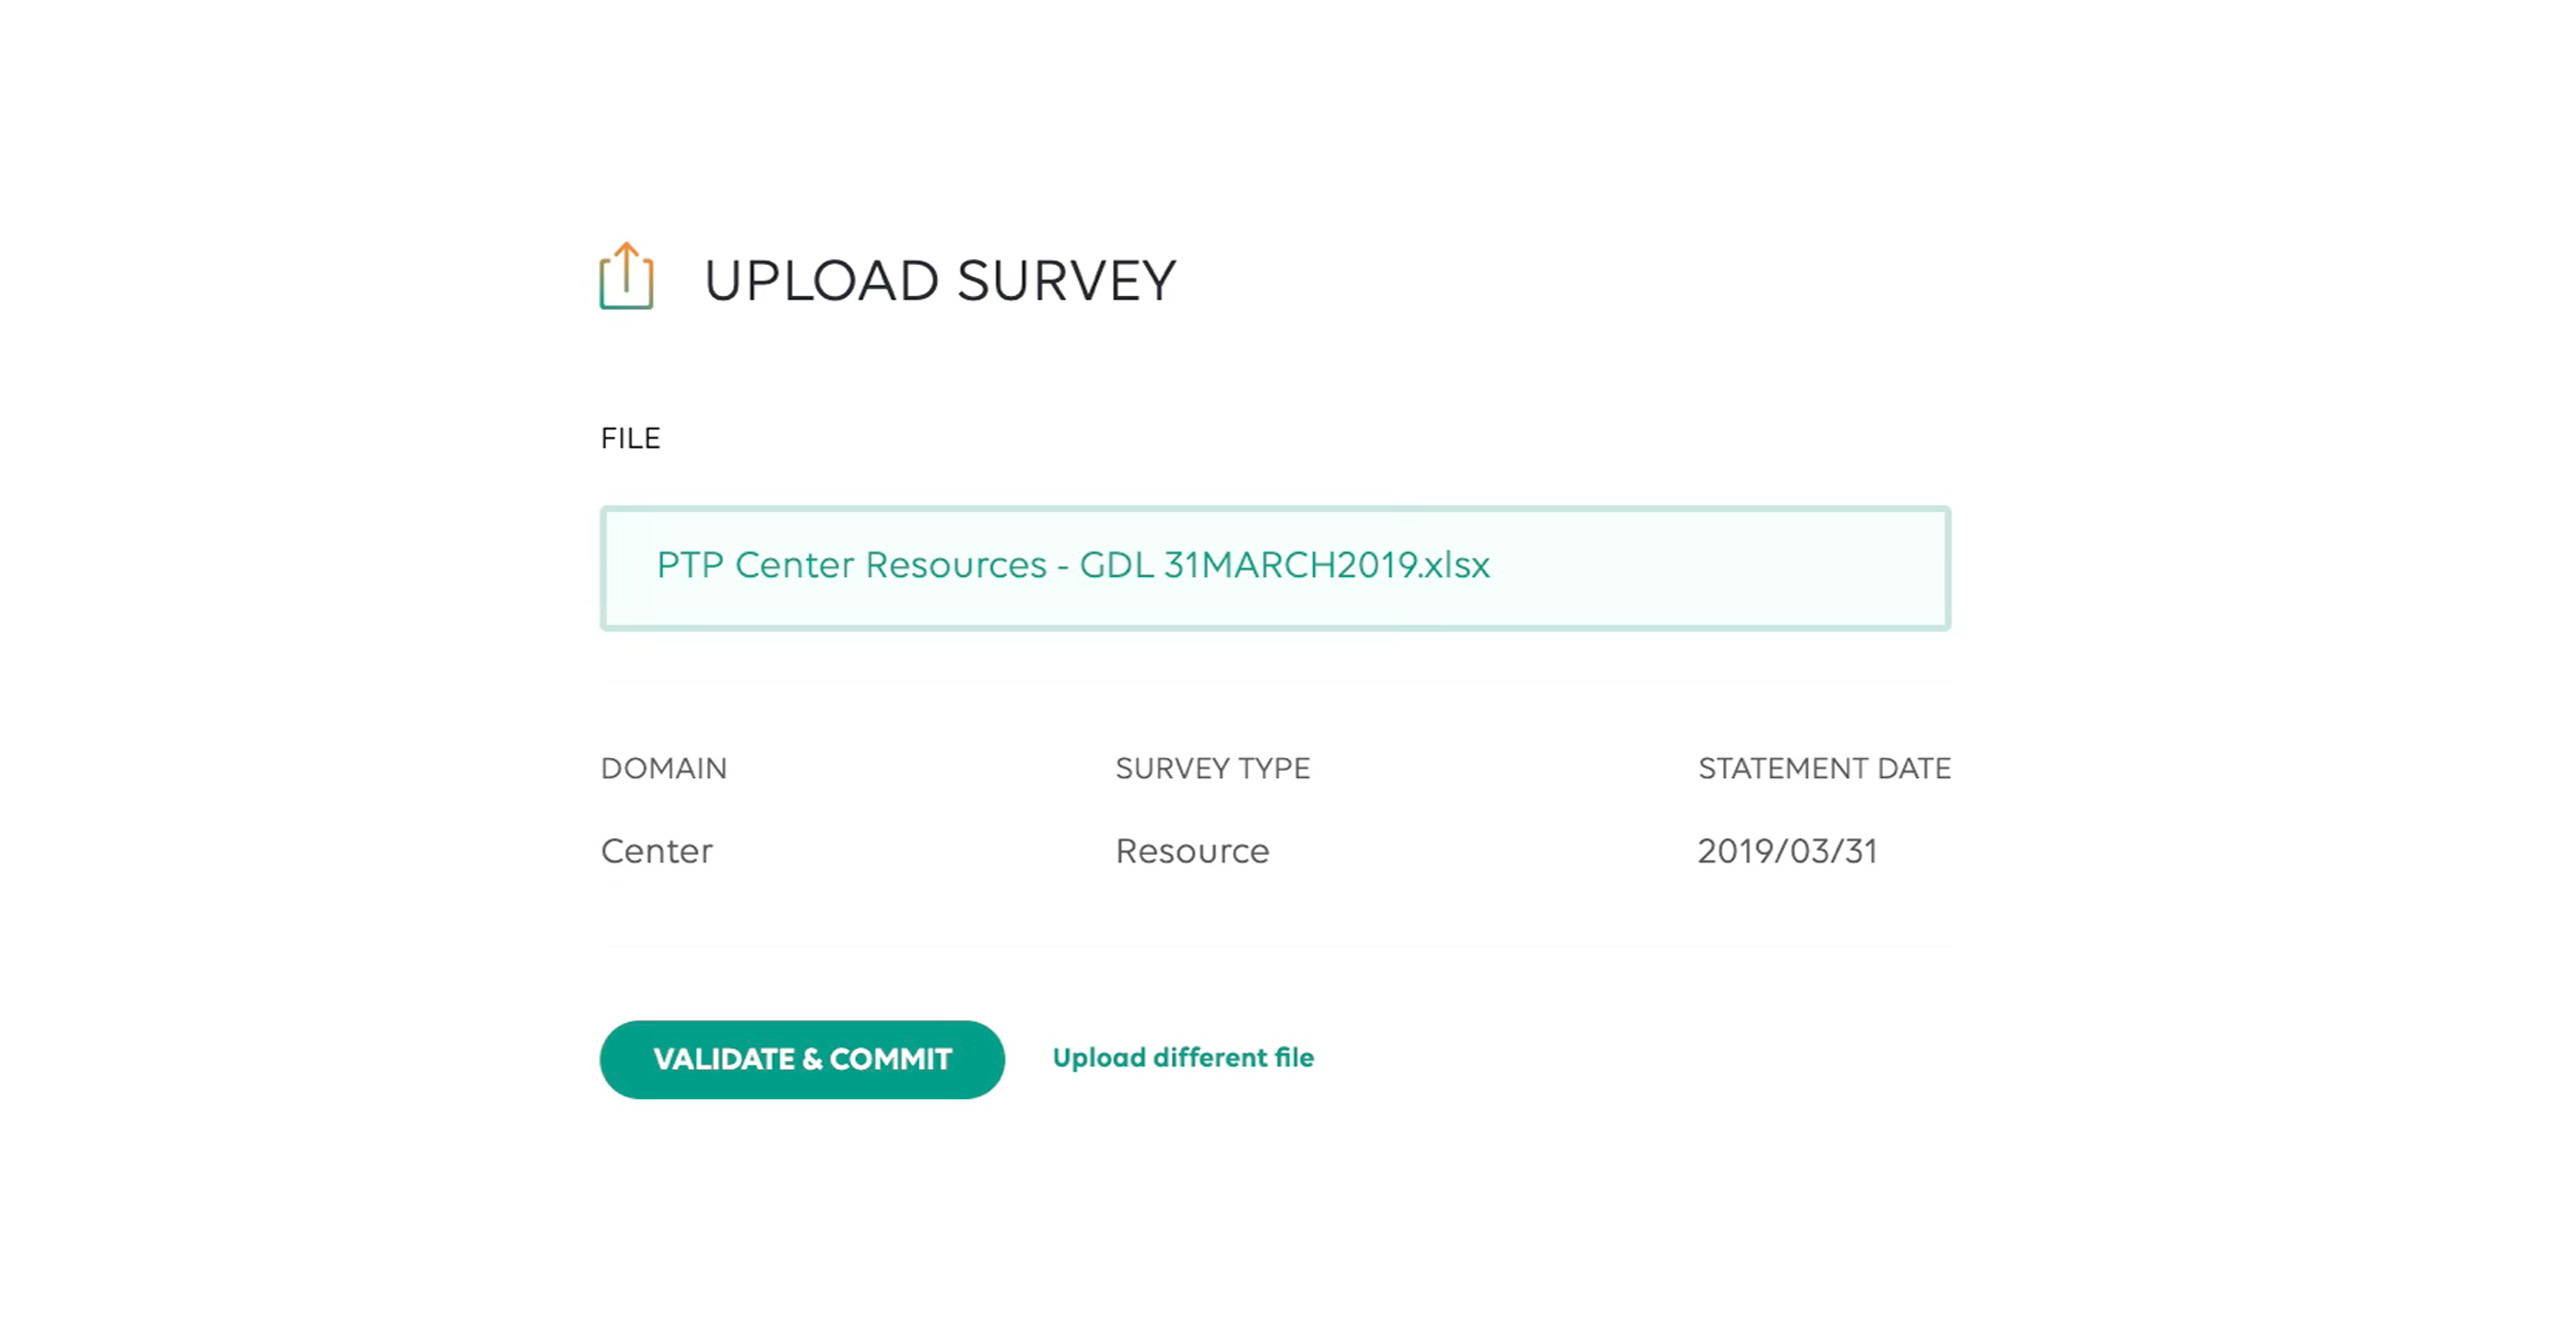
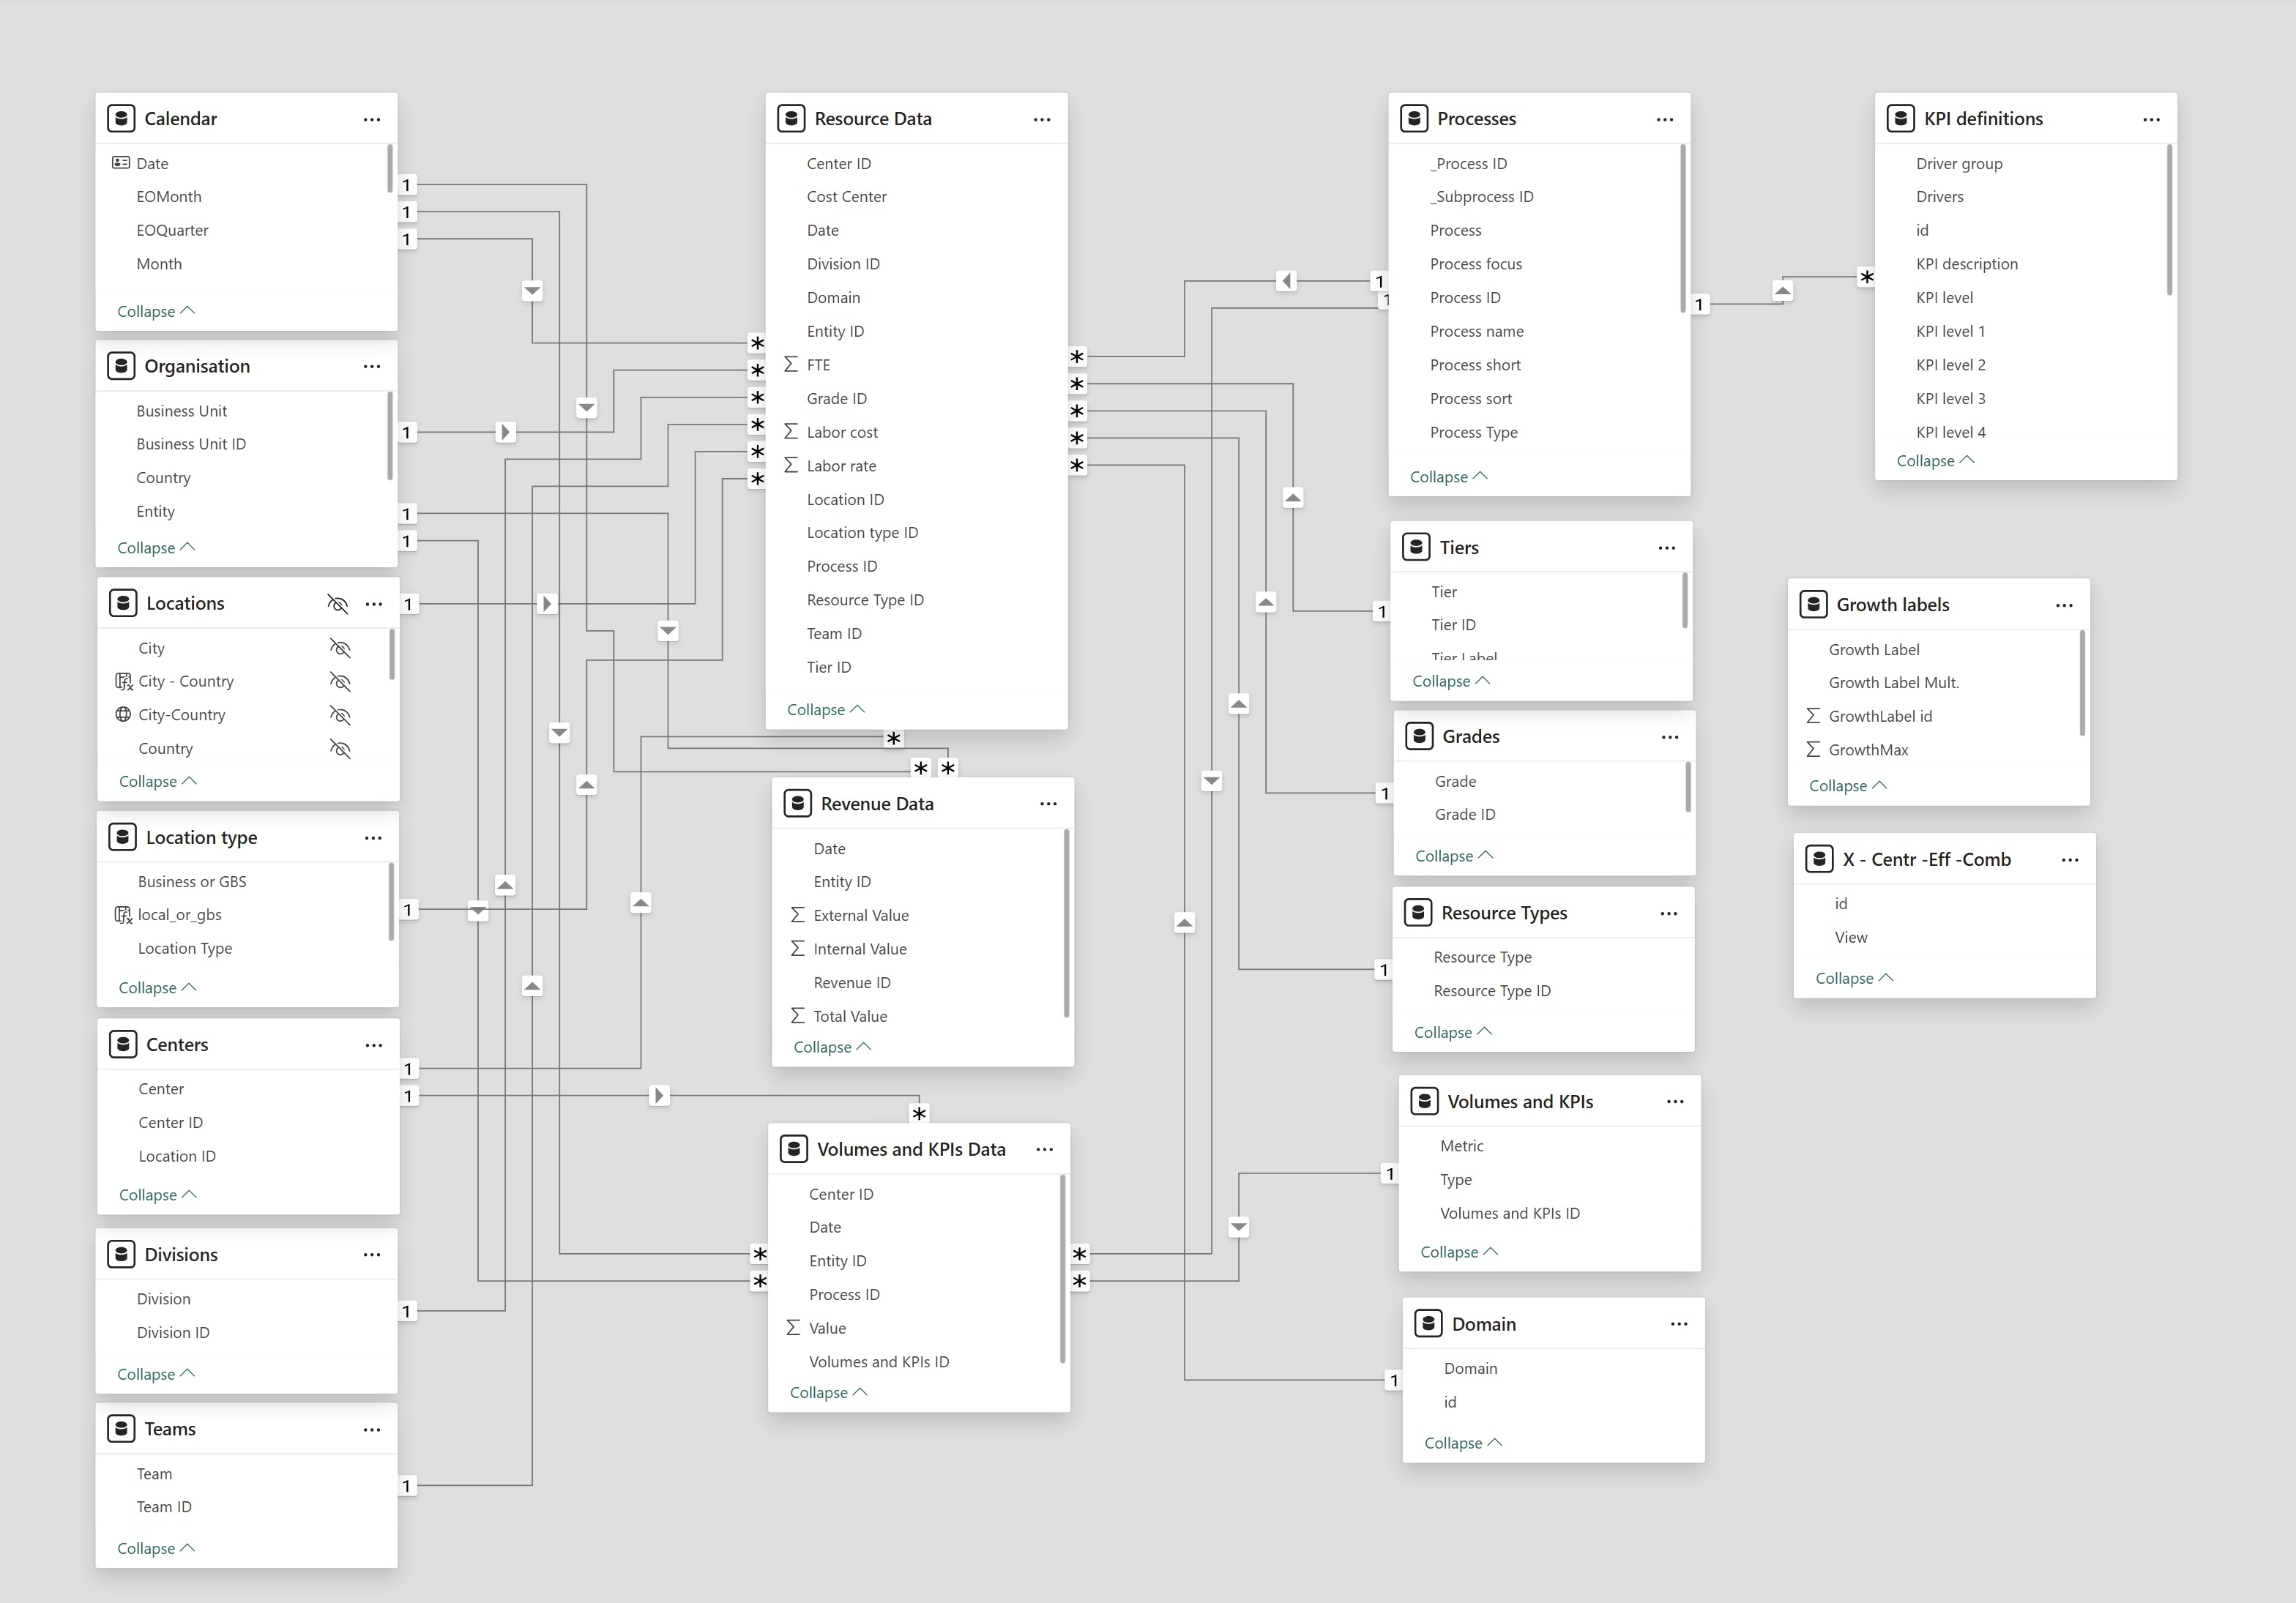
Modeling Icon

CI Data Center

Configure Connected insight with 100% your operating structure and definitions.
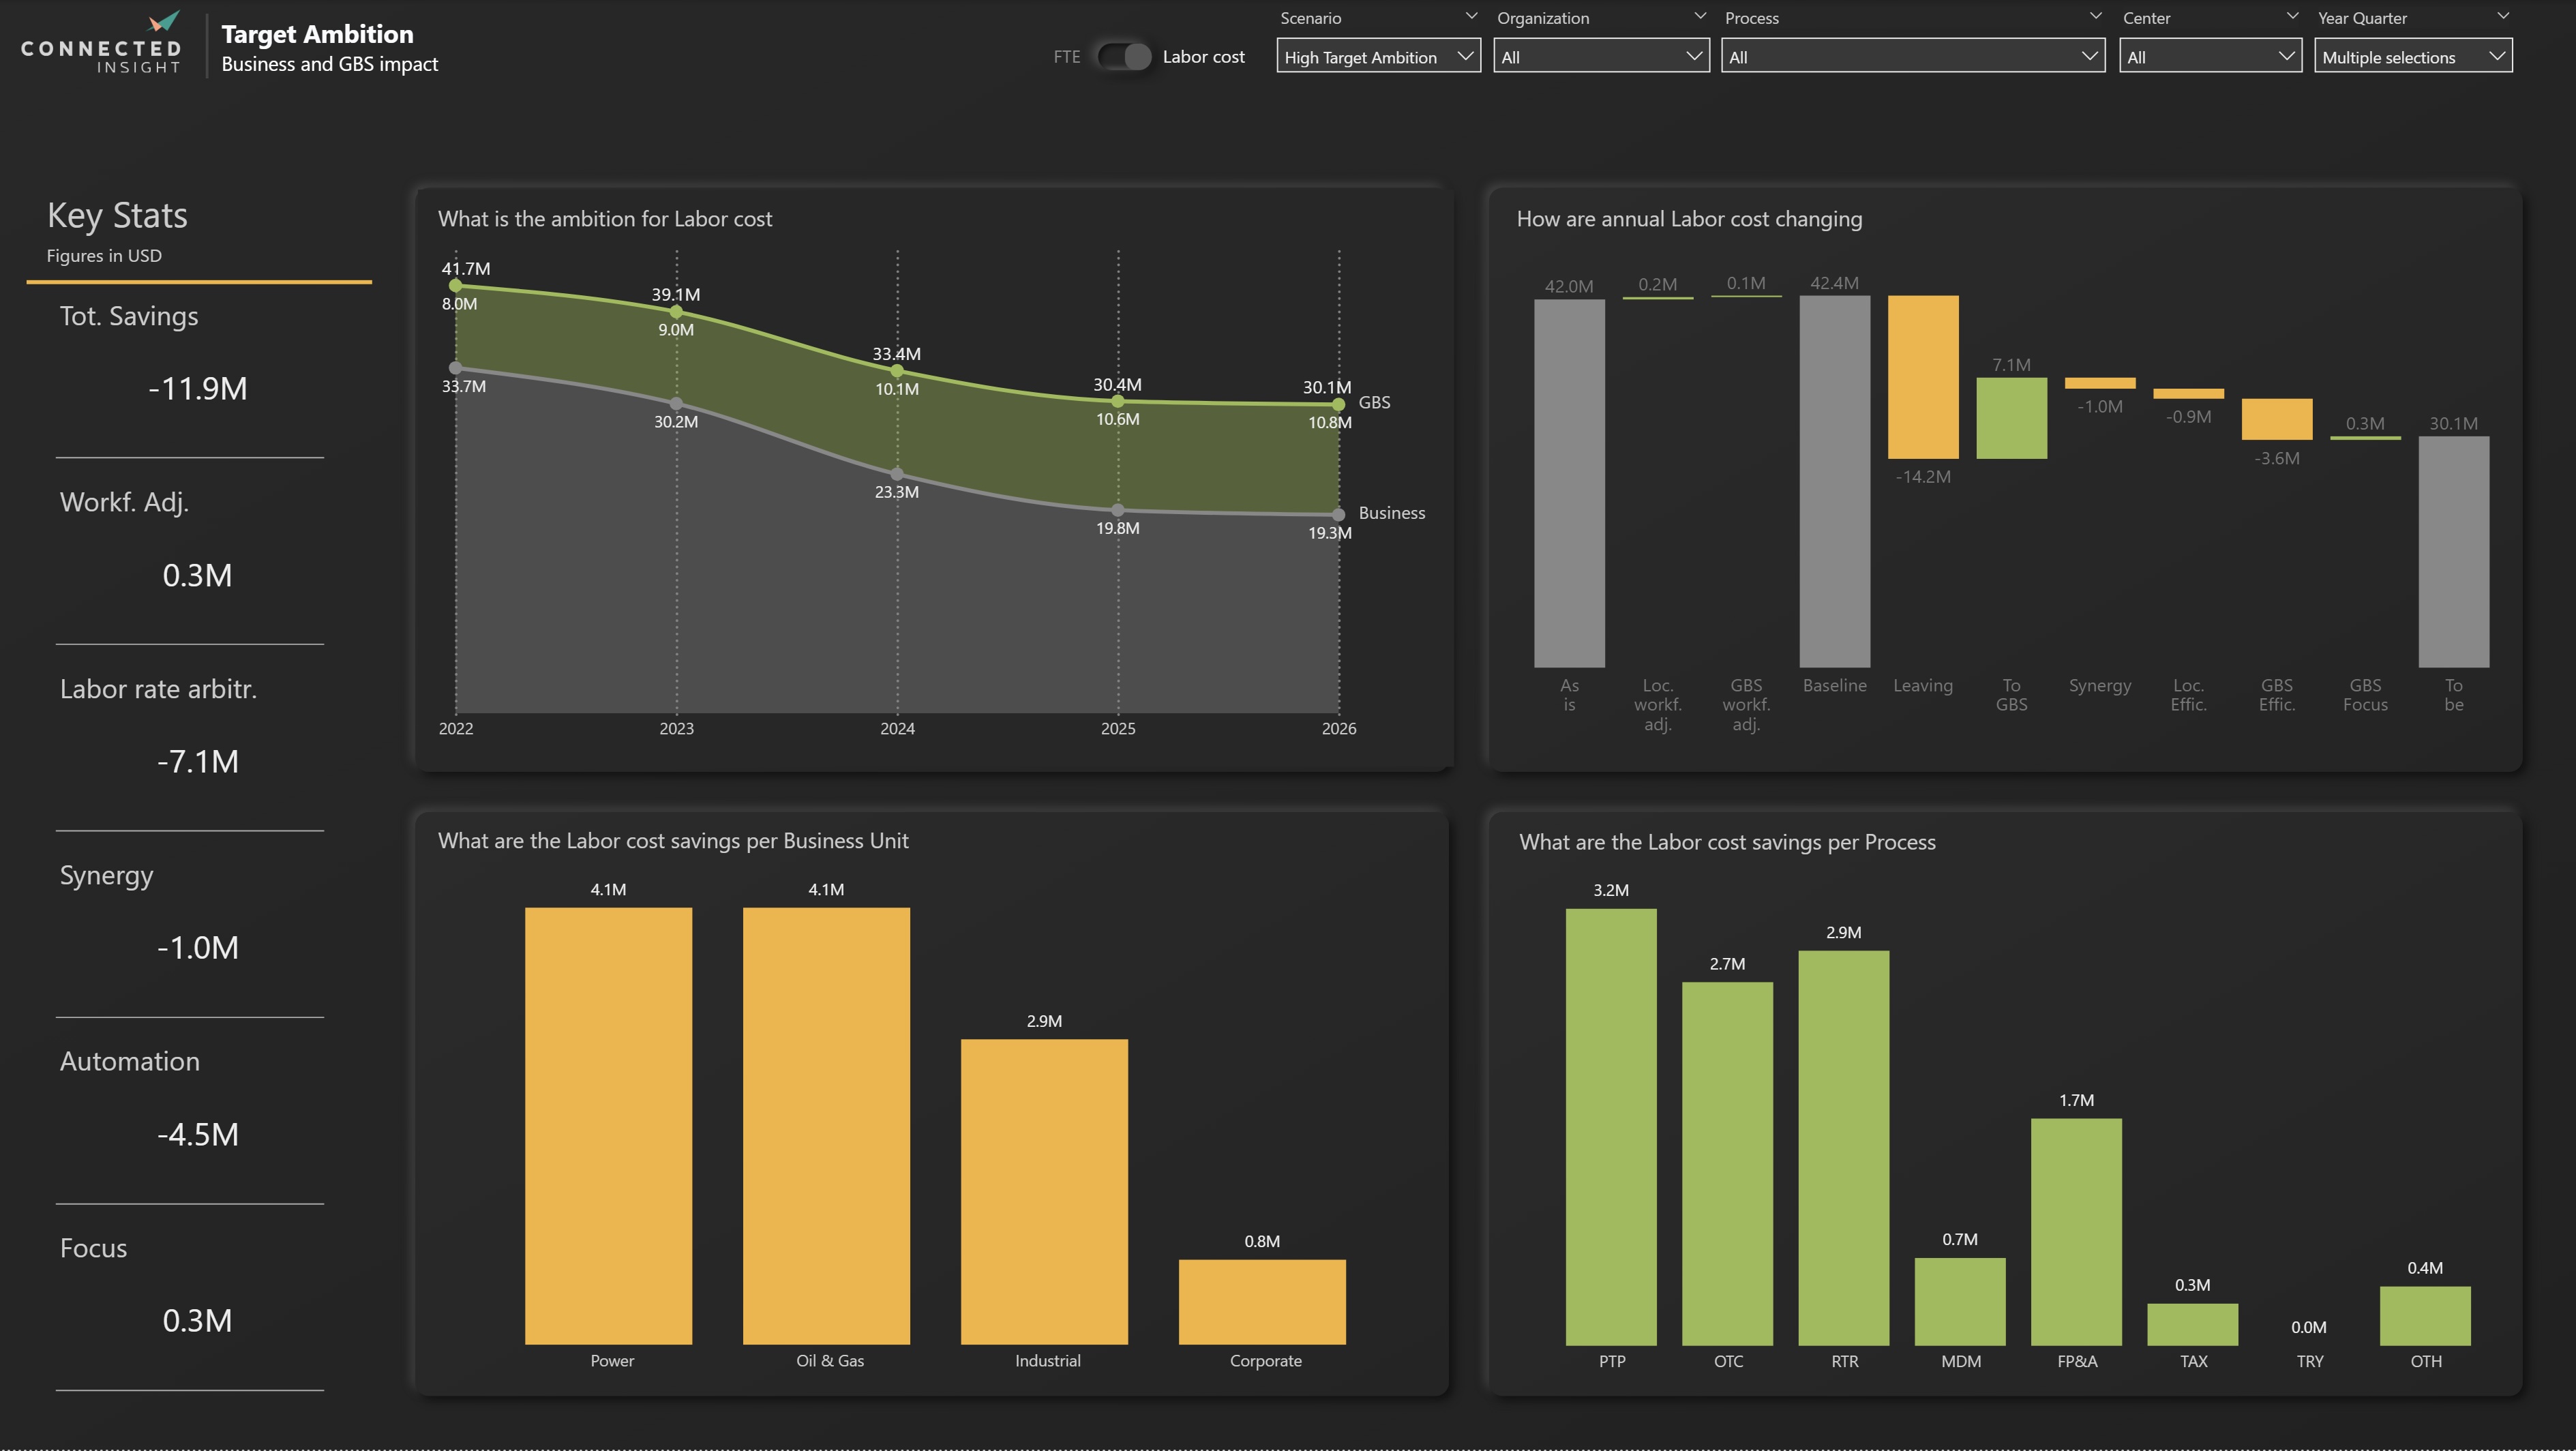
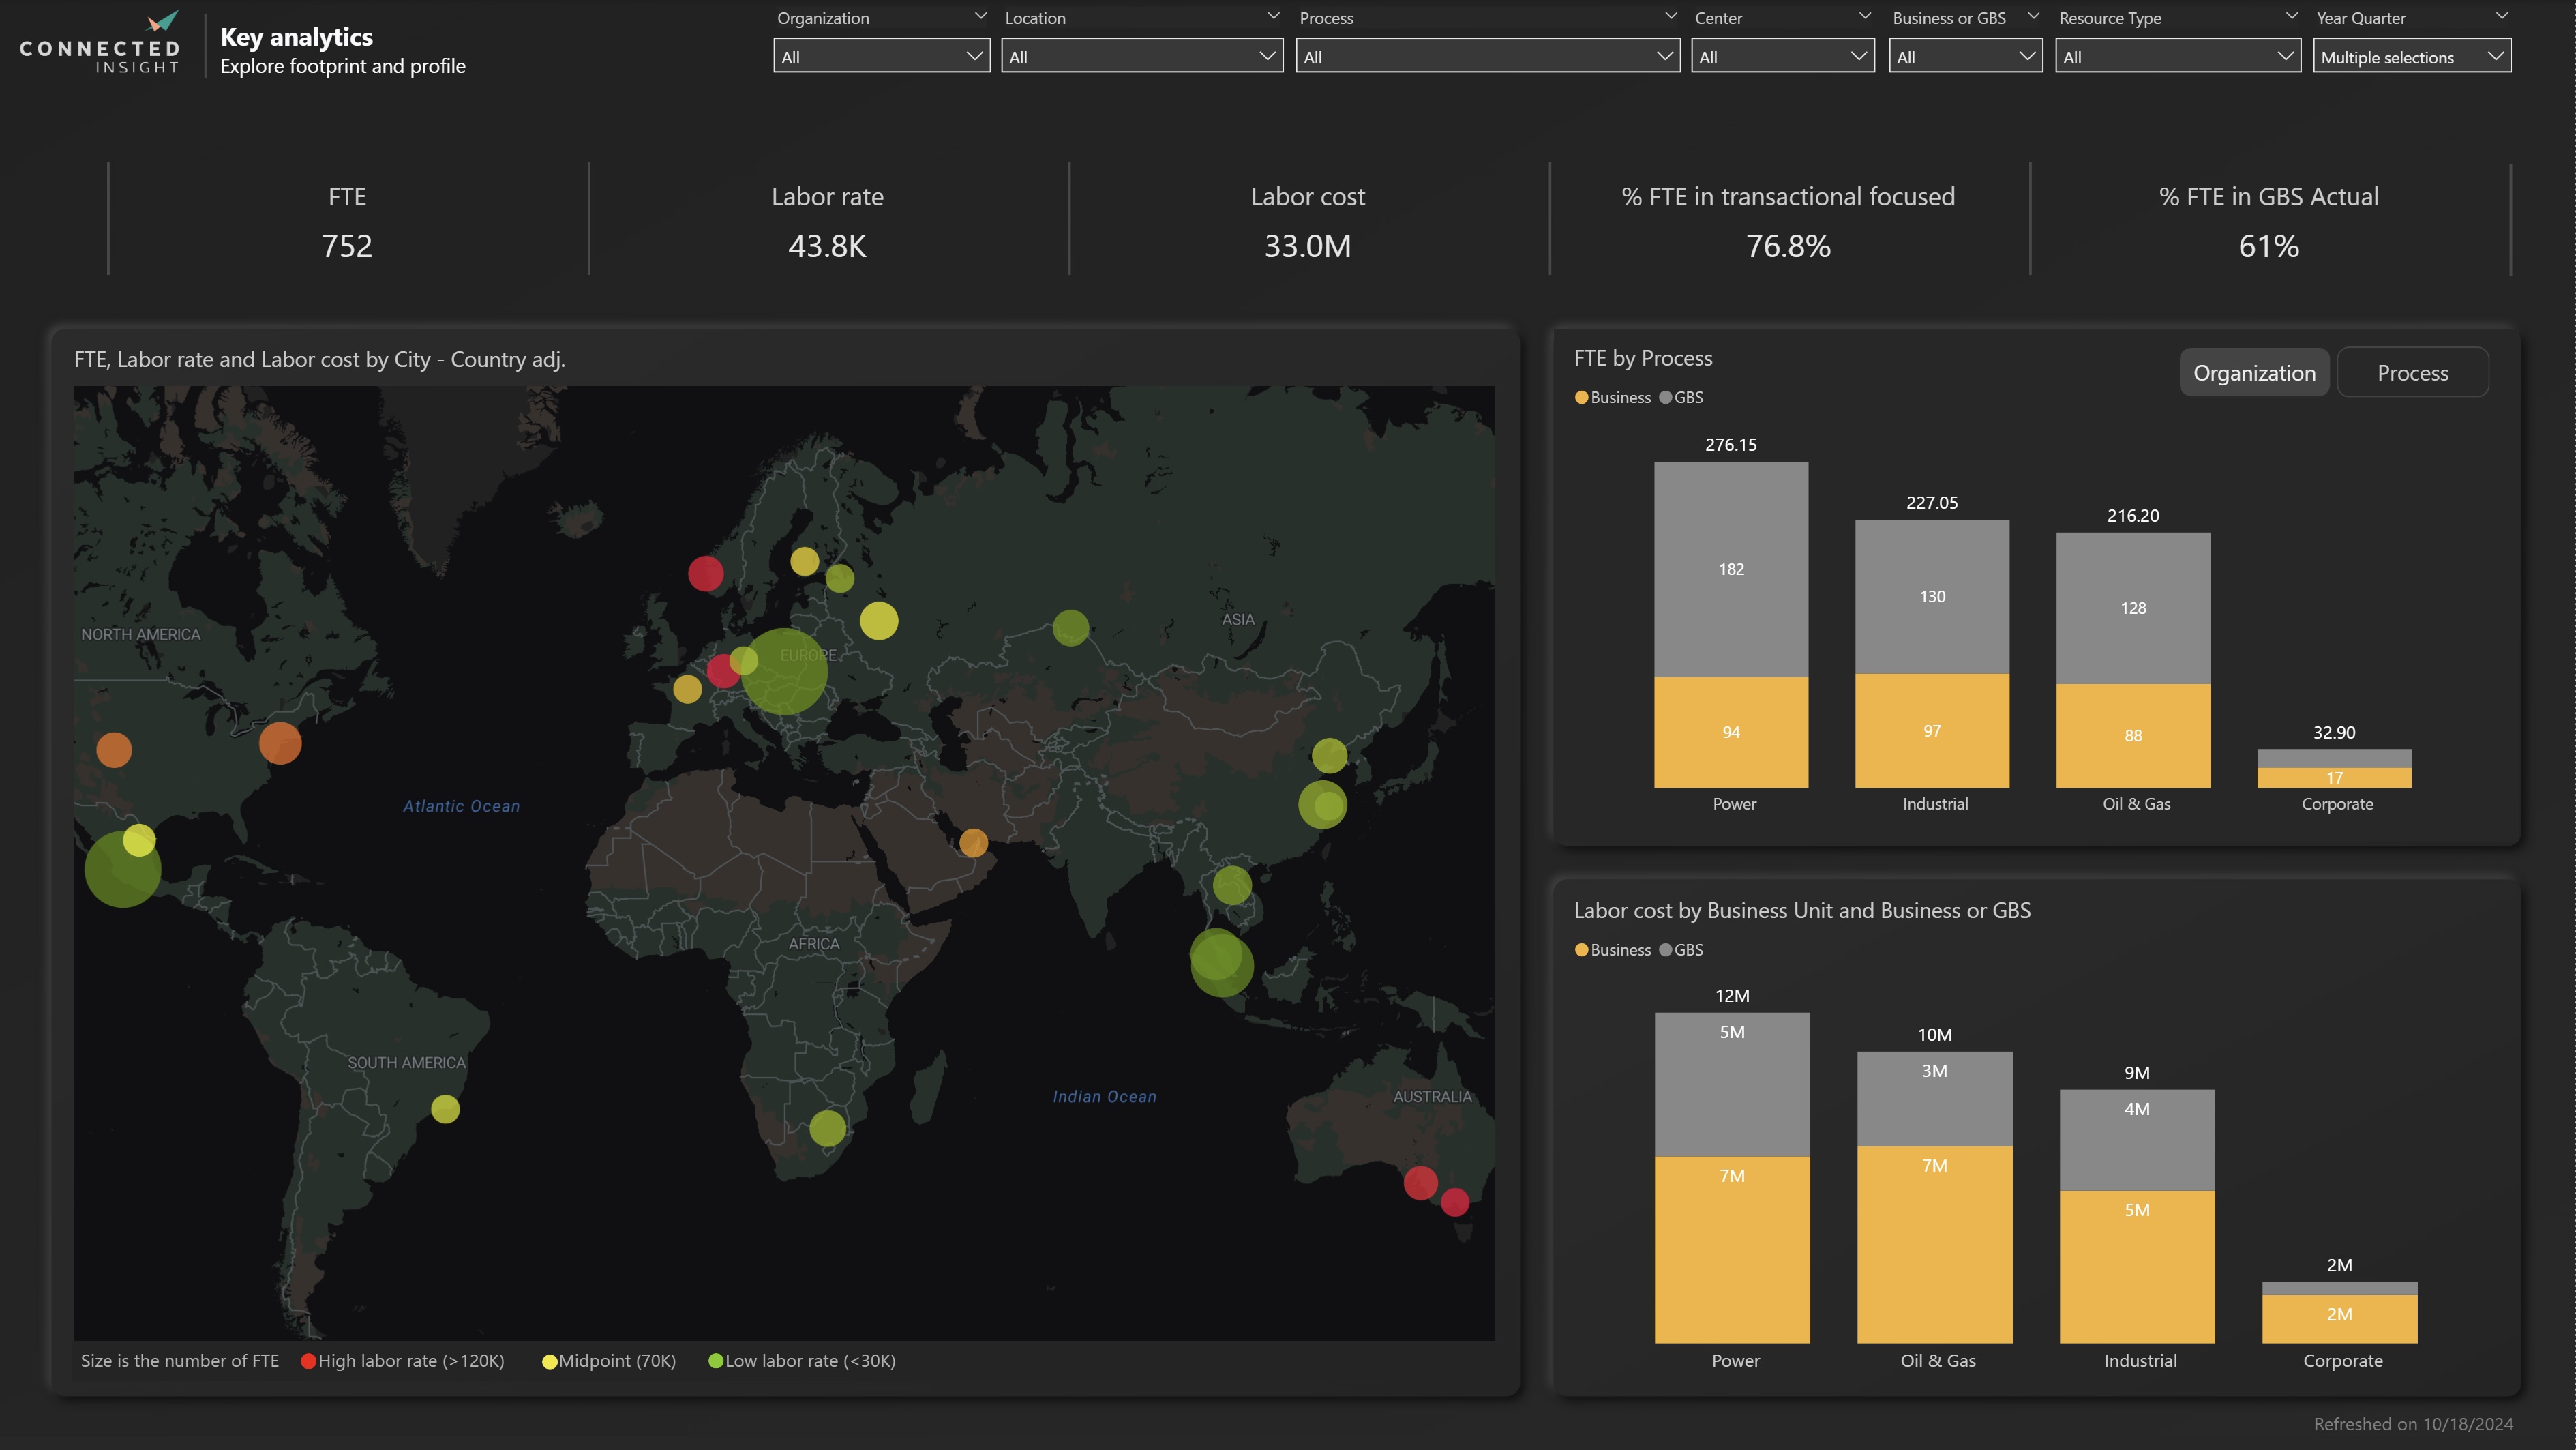
Modeling Icon

CI Analytics

Pre-built and customizable data models and dashboards accelerate your impact and empower your team.
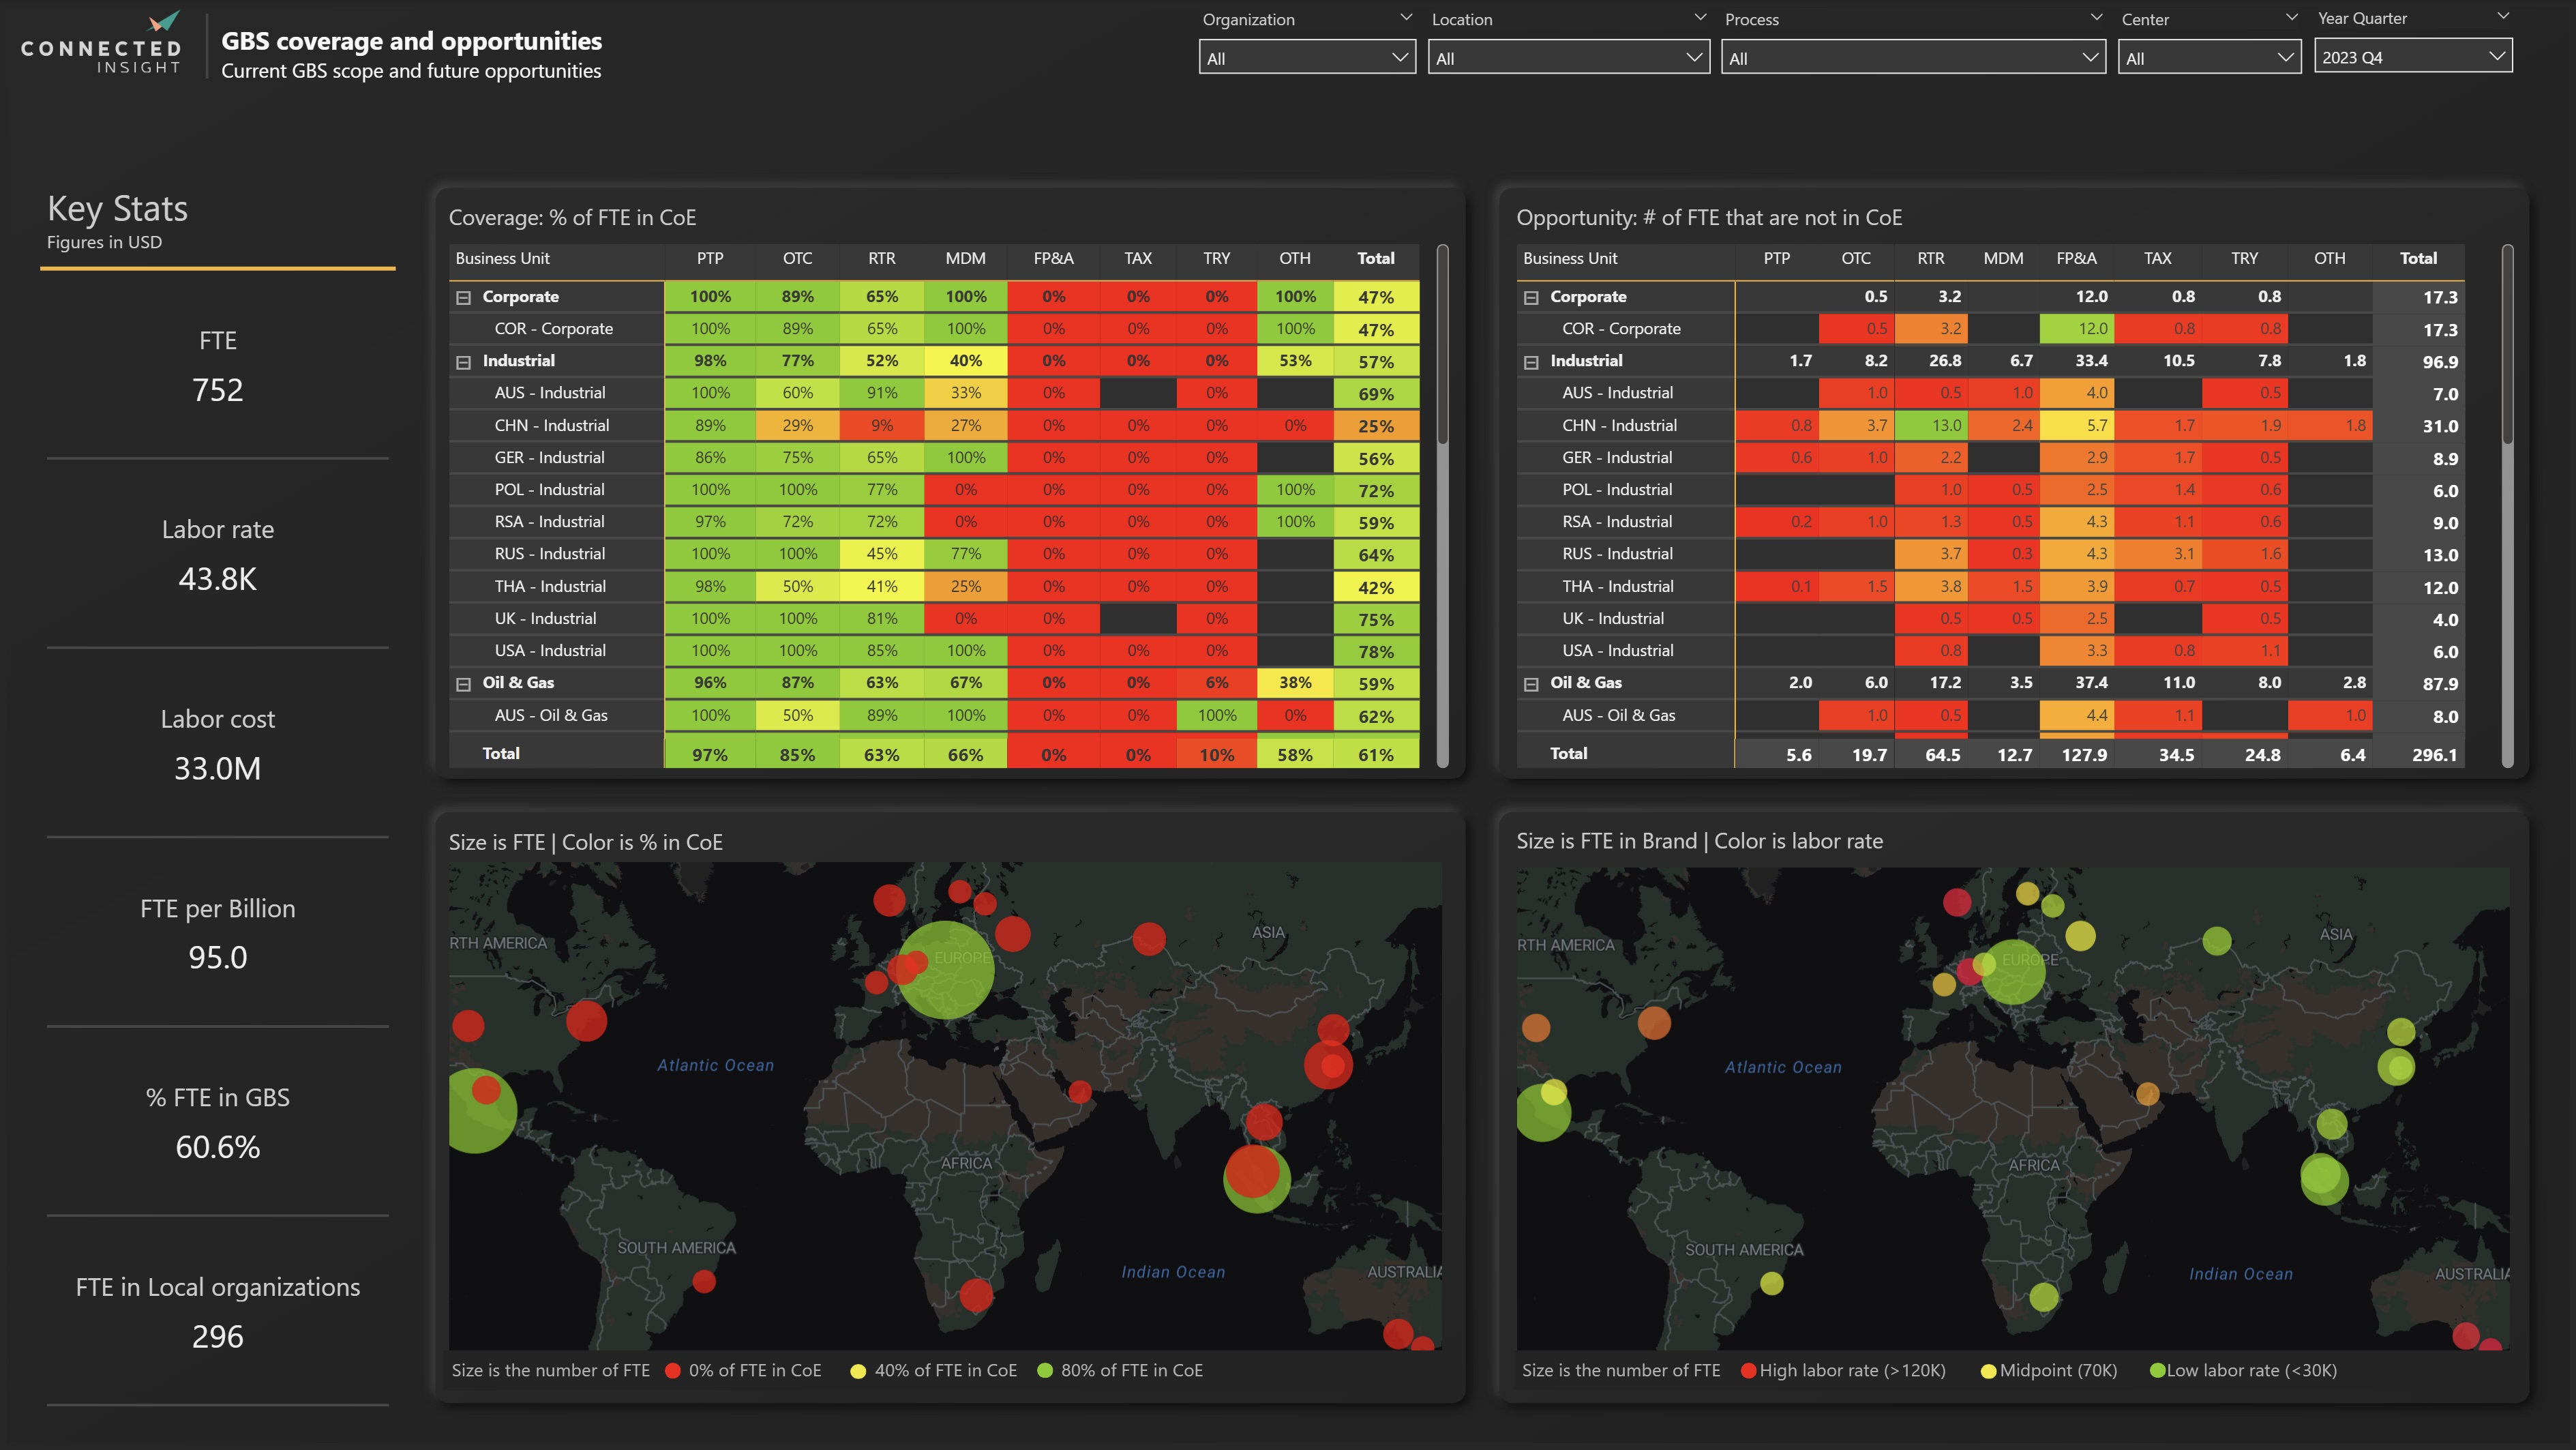
Modeling Icon

CI Benchmarking

Industry-specific benchmarking with APQC process integration and internal benchmarking across Cl's 12 dimensions.

01 - 03
5X
Get 5 times the analytics and insight compared to ERP data consulting firms and their traditional methods.
100%
CI is configured with 100% your operating structure and definitions. Your analytics now align with your business
12
Insight through 12 different and process dimensions. Zero-in on what you need to drive your objectives.
7-10
Deployment and data gathering is done in 7-10 business days. The process is fast and efficient, reflecting more than 20 years of experience.
“Why would I want a thick PowerPoint file of static data when we can have a dynamic discussion using CI?”
CFO, $5 Billion manufacturer

CI Data Center

Structured and efficient data collection, clean and actionable data

Organizational modeling screenshot
Modeling Icon

Organizational modeling

Configure Connected Insight with Definitions based on your unique operating structures, process definitions, and terminology. Analytics with no blind spots.

Efficient data sourcing screenshot
Modeling Icon

Efficient data sourcing

Controlled and efficient data gathering and processing.

Instant data validation screenshot
Modeling Icon

Instant data validation

Validation for ensuring data integrity and accuracy.

Let's talk

Ready to experience the power of data-driven transformation?

APQC w/ 4 dimensions screenshot

CI Analytics

Valuable new data into actionable insights with fast and efficient process

Modeling Icon

Data model and calculations

A pre-defined data model and calculations for finance, HR, IT and other business functions.

Data model screenshot
Modeling Icon

Dashboards

Pre-configured and complex analytics and dashboards for finance, HR, IT and other business functions.

Customize dashboards to the uniqueness of your focus.

Dashboards screenshot
Modeling Icon

Multi-Dimensional analysis

One data set covering 12 dimensions across organizational, geographical and process definitions.

Multi-Dimensional analysis screenshot
Modeling Icon

Target simulation and tracking

Scenario model your potential target objectives and benefits. Use CI’s bottom-up target definition methodology to build practical roadmaps. Drive your progress using baseline, actual, and target tracking in multiple dimensions.

Target simulation and tracking screenshot
Modeling Icon

Accessible in your environment

The data and analytics available in your environment

Accessible in your environment screenshot

CI Benchmarking

Improved focus and decision making

APQC benchmarking screenshot
Modeling Icon

APQC Benchmarking

Industry-specific benchmarking with APQC process integration and internal benchmarking across Connected Insights’ 12 dimensions