Transform insights into influence for shared services and transformation
Empowers Shared Service and Transformation Program Leaders with an all-in-one platform for data management, performance tracking, and benchmarking
Empowers Shared Service and Transformation Program Leaders with an all-in-one platform for data management, performance tracking, and benchmarking
Shared Services Leaders prove their value by capturing essential data and turning it into clear insights. Quickly answer questions, set goals and show results.
Transformation Leaders build a structured and data-driven transformation process with automated data workflows and clear insights.
Achieve measurable progress and demonstrate your value with less effort
Three integrated functions. Move 5x faster and deliver 5x more insight.
Your structure and definitions
Low effort fast process
Lead with confidence
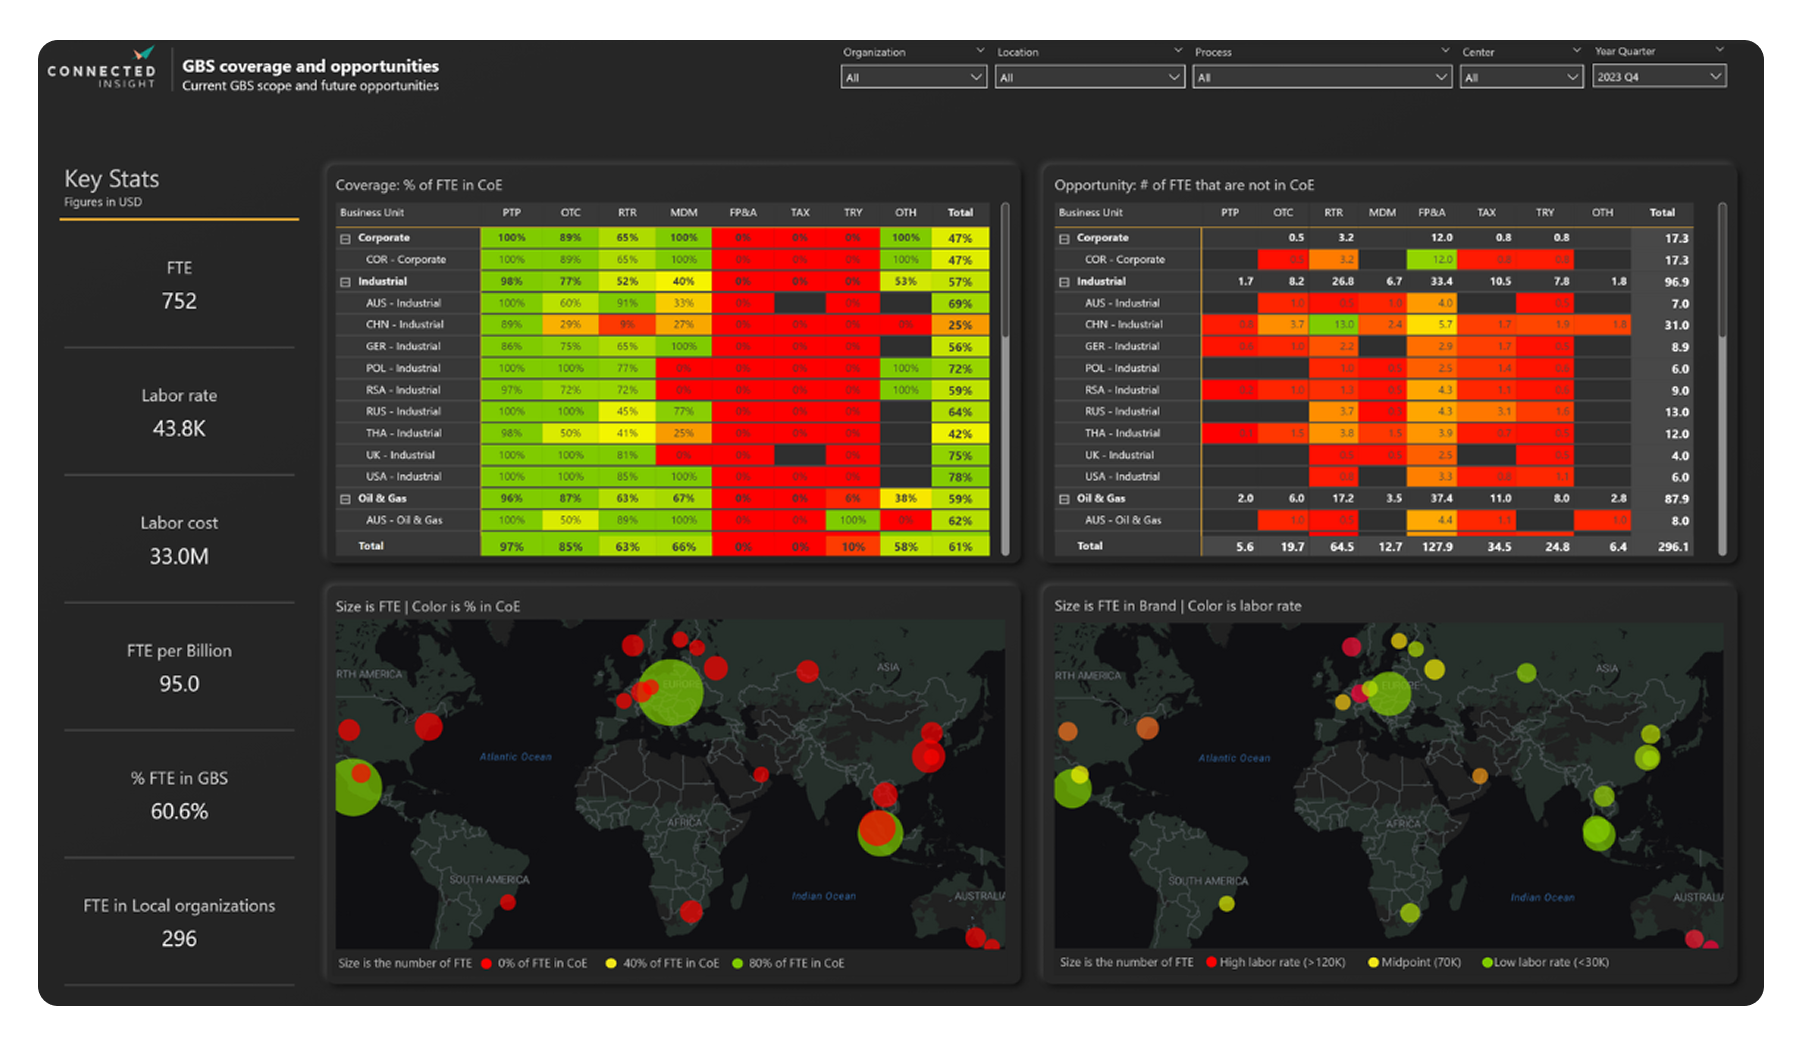
Industry-specific benchmarking with APQC process integration and internal benchmarking across Cl's 12 dimensions.
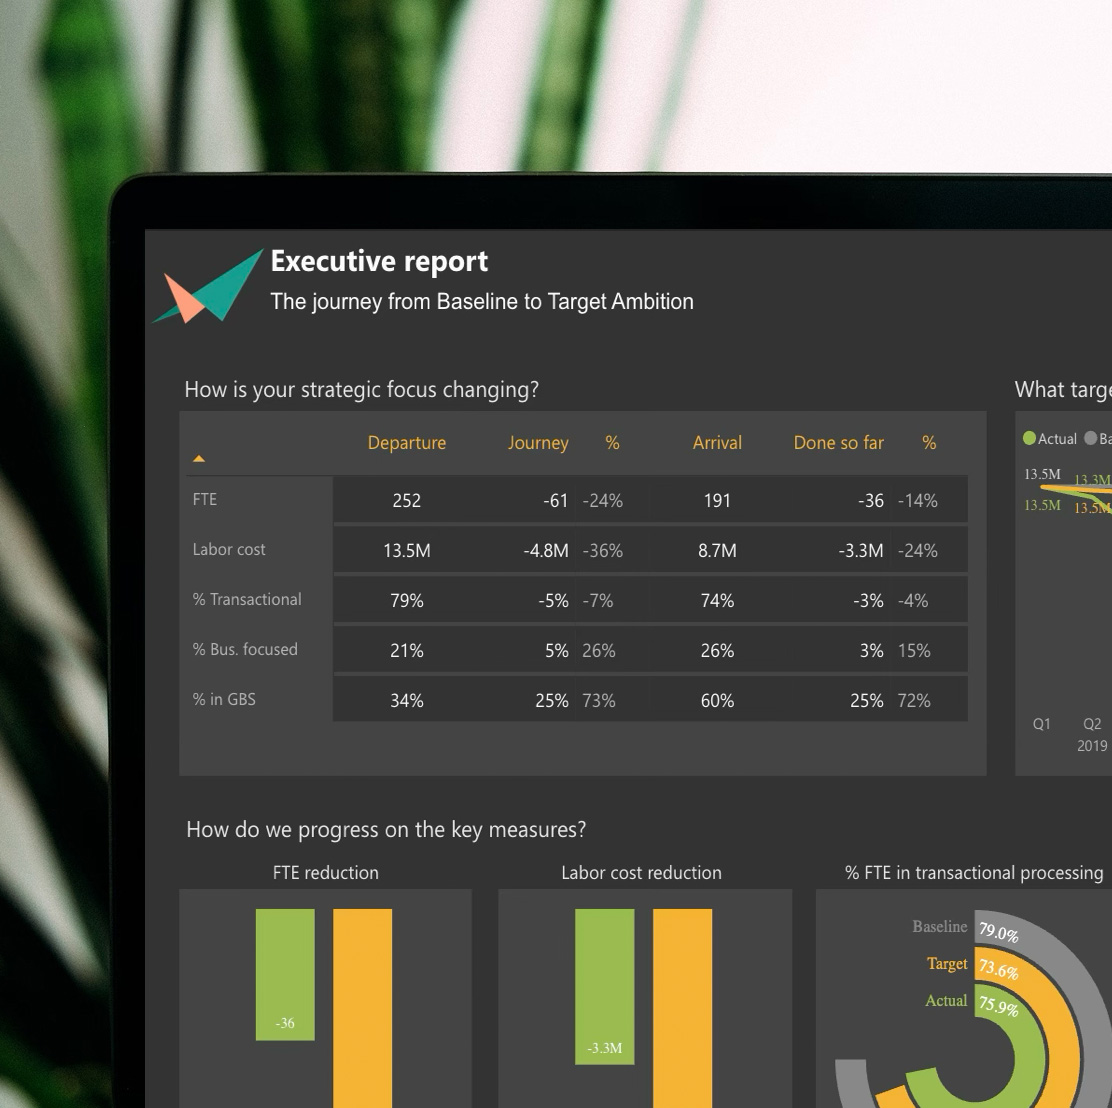
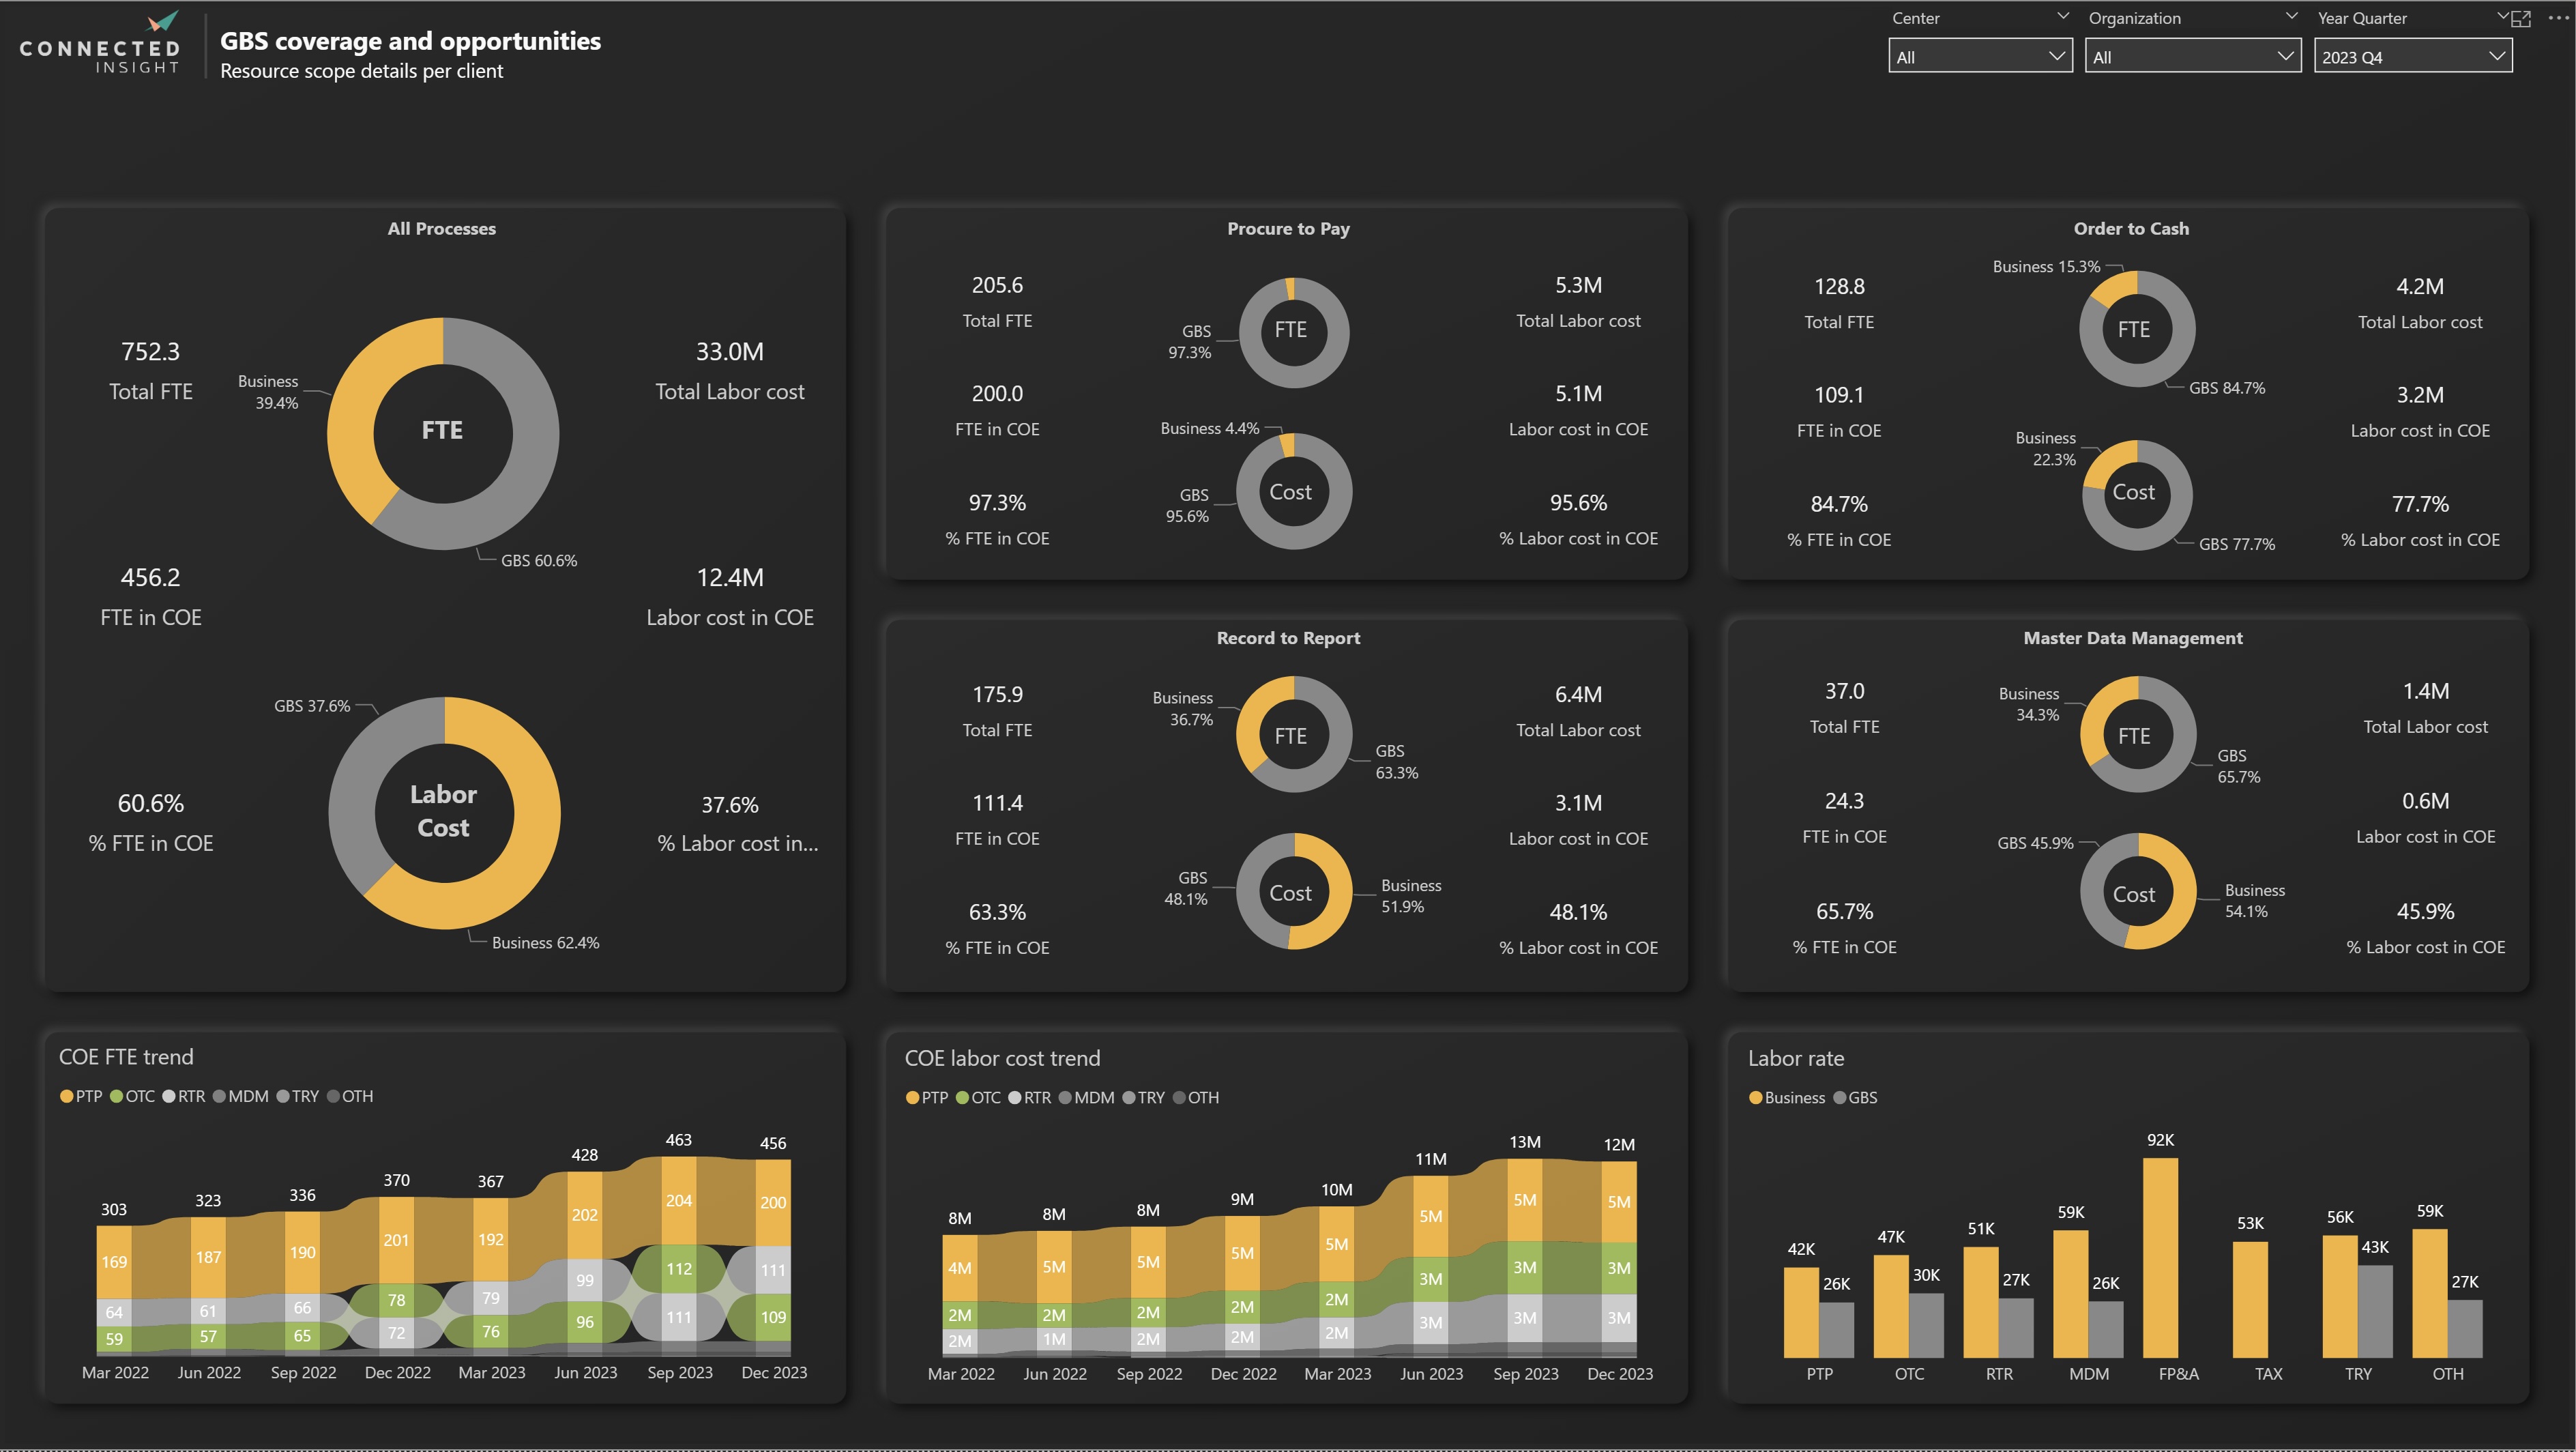
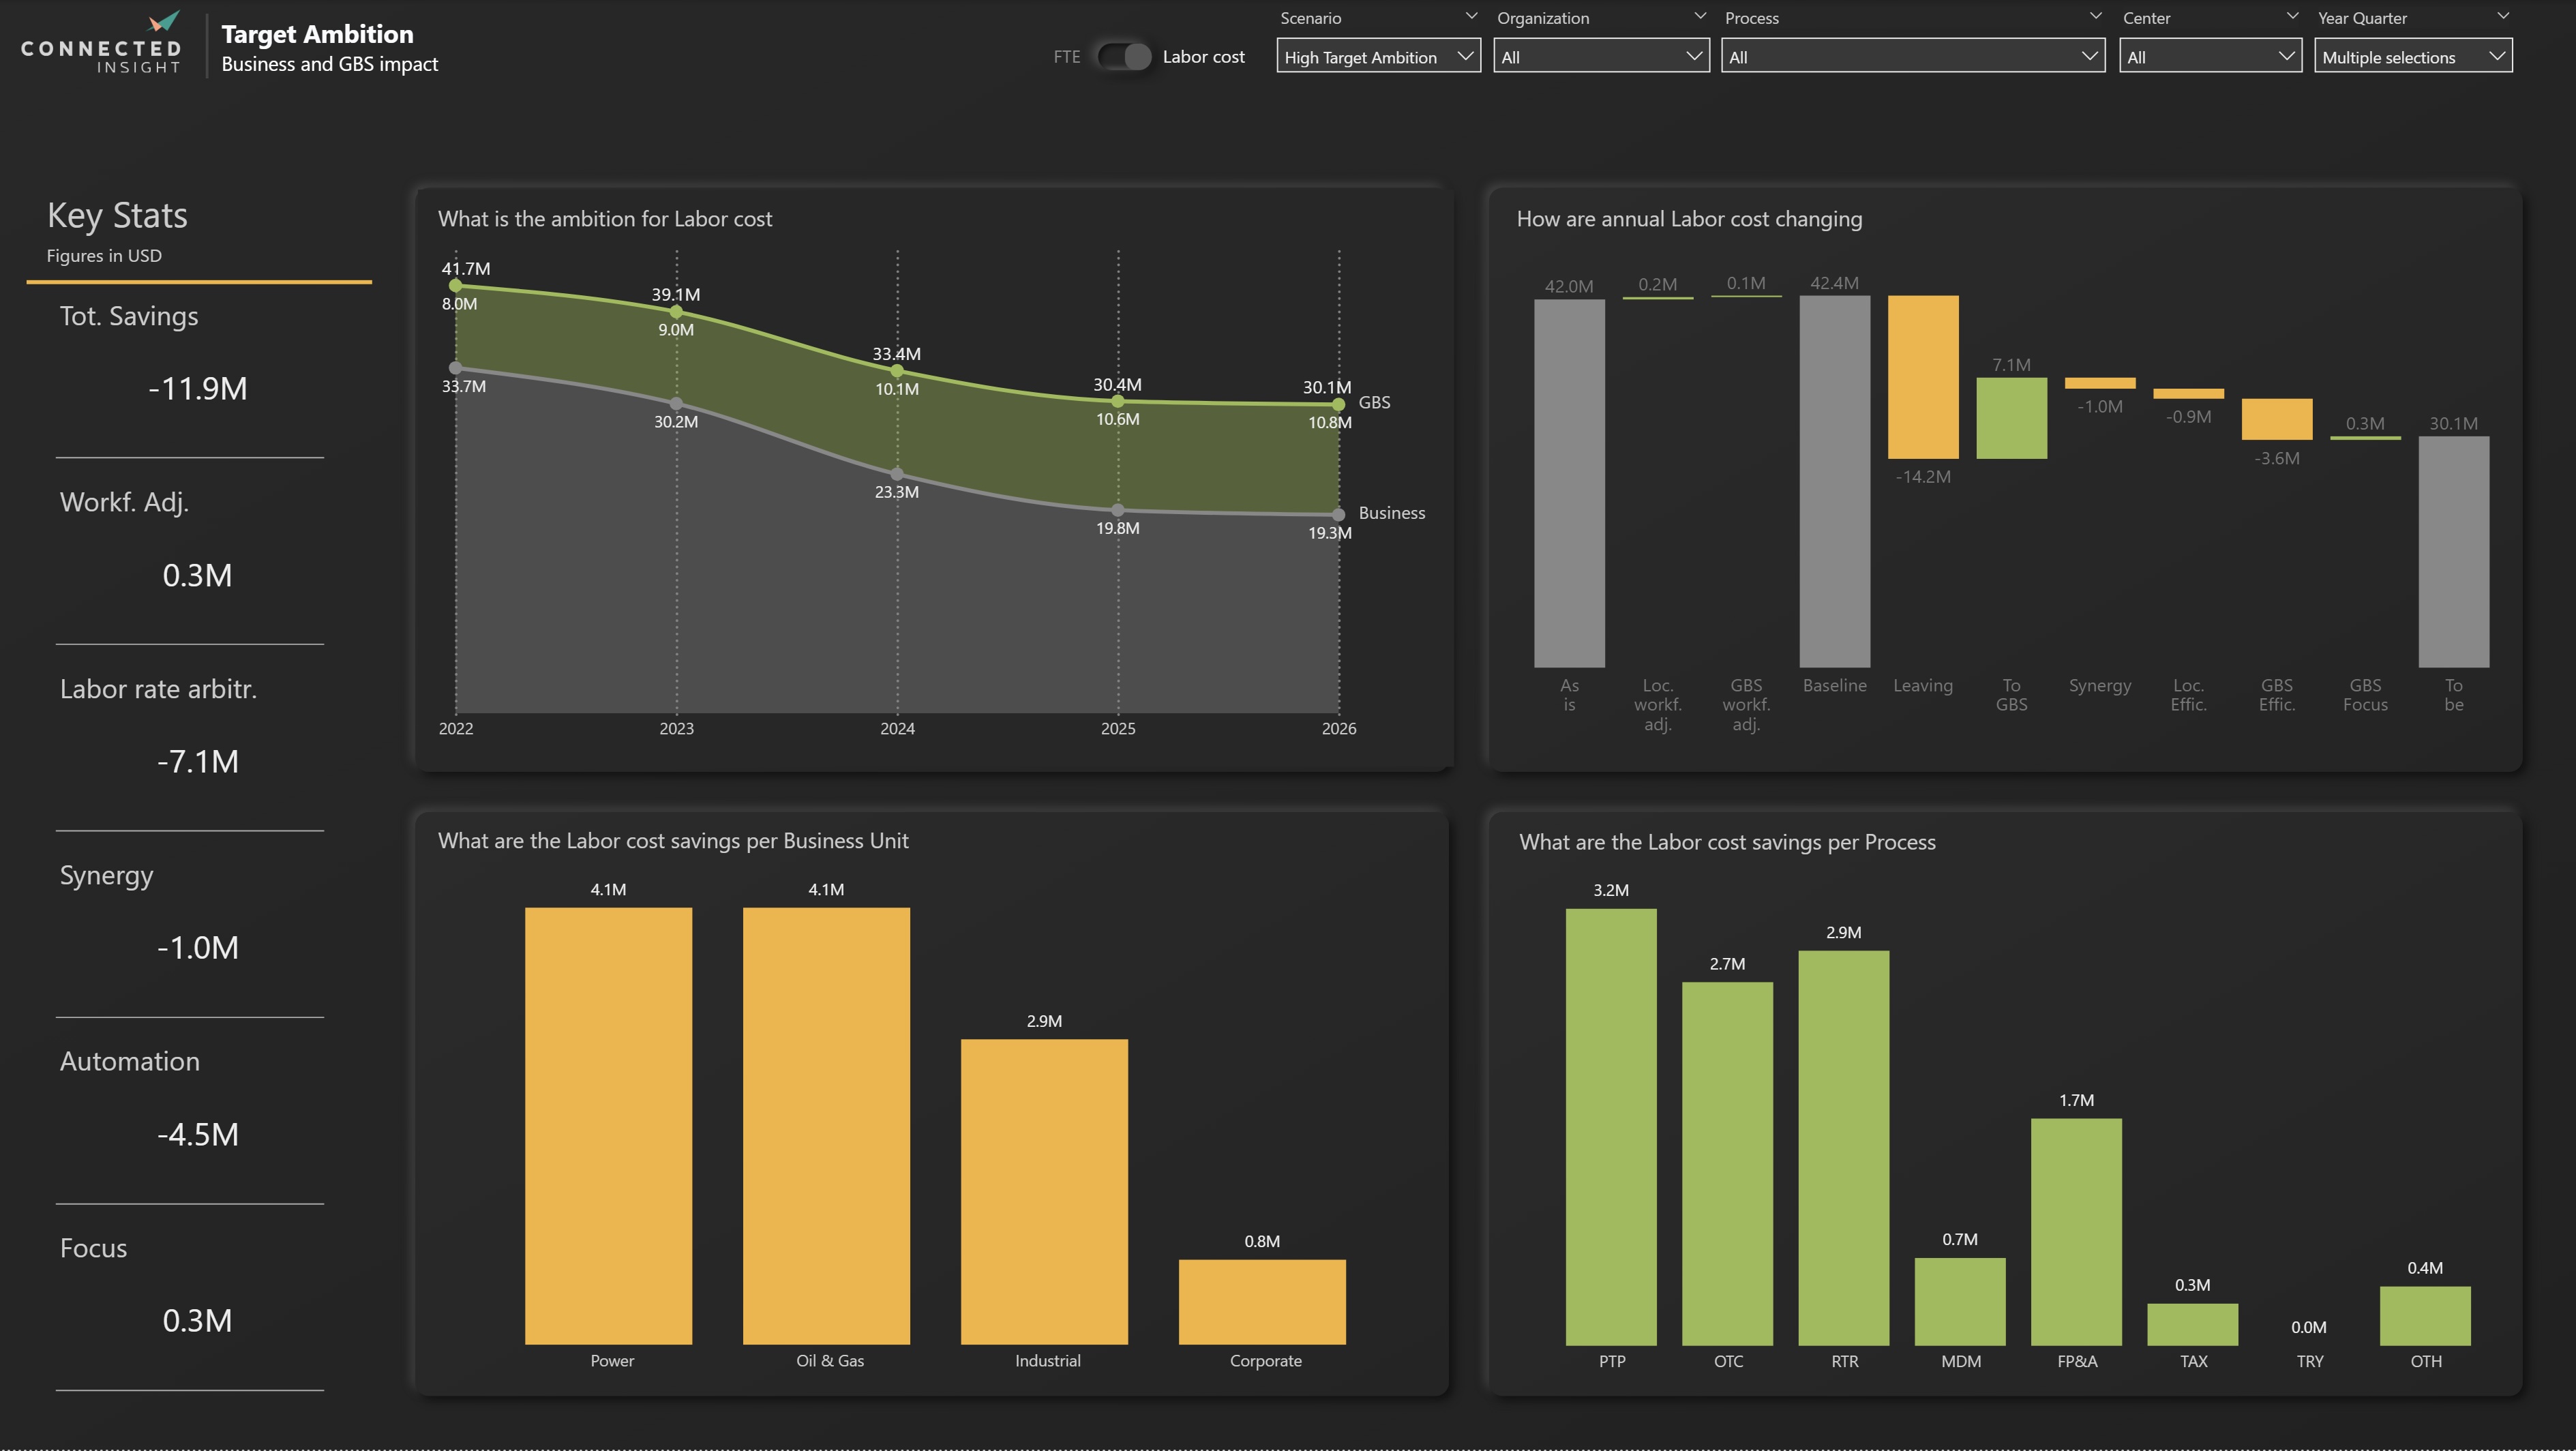
Pre-built and customizable data models and dashboards accelerate your impact and empower your team.

Achieve measurable progress and demonstrate your value with less effort
See how our team can support your programs. Our team blends deep consulting and industry experience to provide thoughtful and practical advisory services.
Our clients are regional and global. They are big and not so big. They are the whole company or a division. They cover diverse industries. They are in all regions of the world. They are focused on one function or the whole operation. They want to set informed targets, move fast.
"Connected Insight will give you visibility and insight your business leaders have never seen before. I would recommend it to any company for driving a transformation program"
"We now have more insight than we have ever had anywhere at any time"
"Using CI to drive our program is the difference between Google maps and a compass"